
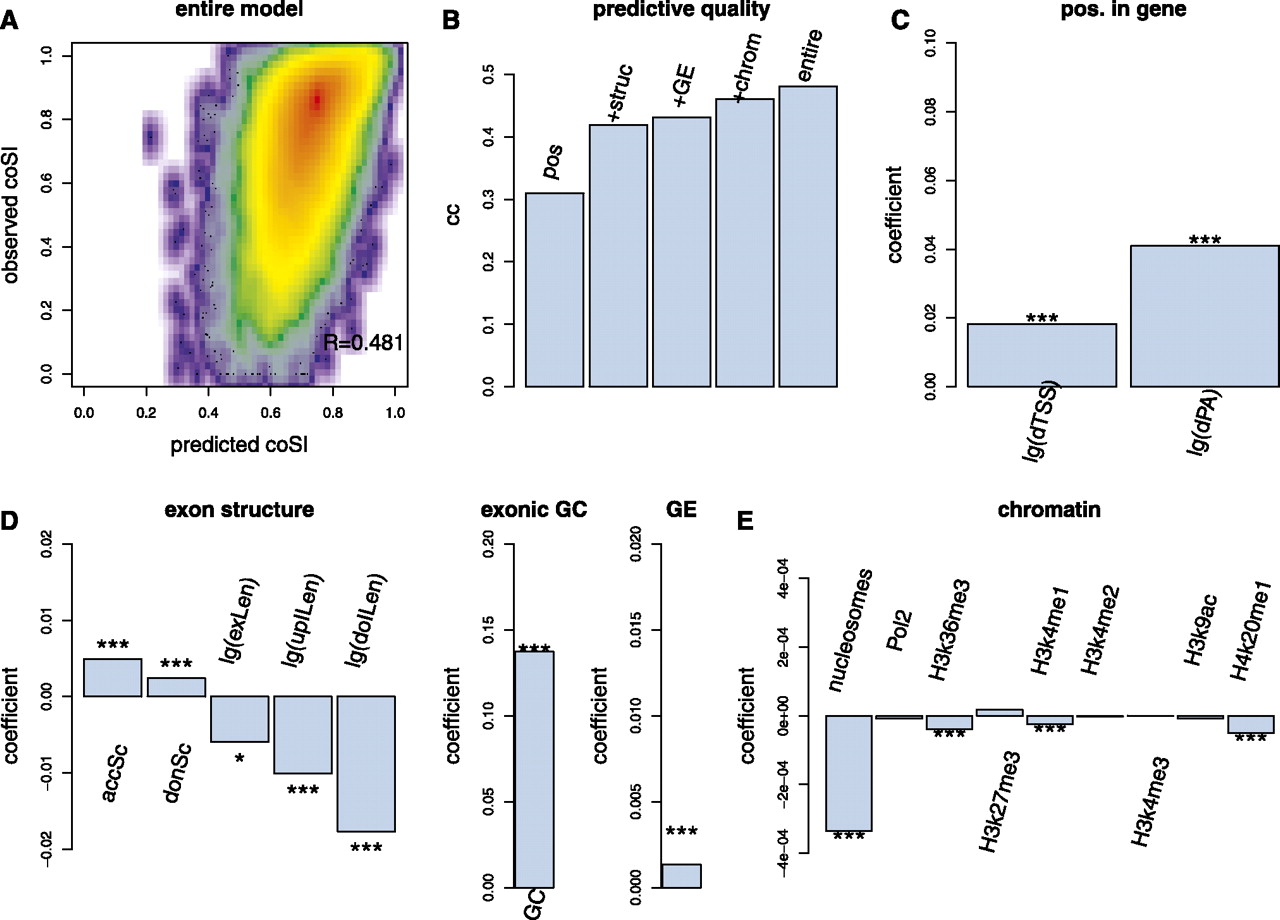
Linear model connecting exon-coSI values to gene, exon, and chromatin structure variables. (A) Smoothed scatterplot and correlation between predicted coSI values and measured coSI values using the entire model. (B) Correlation of predicted coSI values and measured coSI values using four increasing subsets of variables and the entire model: model with distance to TSS and distance to polyA site (pos); model additionally including acceptor strength, donor strength, log-exon-length, log-upstream-intron-length, log-downstream-intron-length and exonic GC content (+struc); model additionally including gene RPKMs from polyA+ nuclear RNA (+GE); model additionally including ChIP-seq related variables (+chrom); model including all variables (entire). (C) Coefficients in the entire model of distance to the TSS and to the polyA-site. (D) Acceptor strength (accSc), donor strength (donSc), exonic GC content (GC), log-exon-length [lg(exLen)], log-upstream-intron-length [lg(upILen)], log-downstream-intron length [lg(doIlen)] and gene RPKMs from polyA+ nuclear RNA (GE). (E) MNase and histone modification values as described in Figure S10.


