
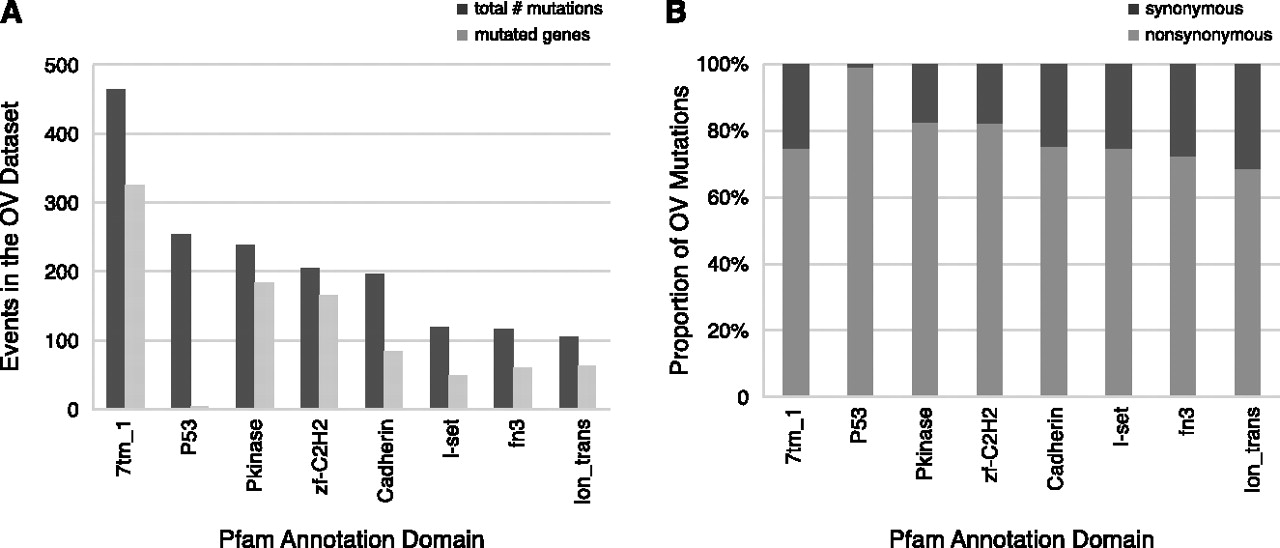
Figure 6.
Pfam domains affected by OV mutations. (A) A histogram of the most highly mutated domains in the OV data set next to the number of genes affected in each domain. (B) A stacked bar-graph where the value 100% represents the total number of mutations in a particular Pfam domain. Lighter and darker sections of the bars represent which proportions of the total mutations are nonsynonymous and synonymous, respectively.


