
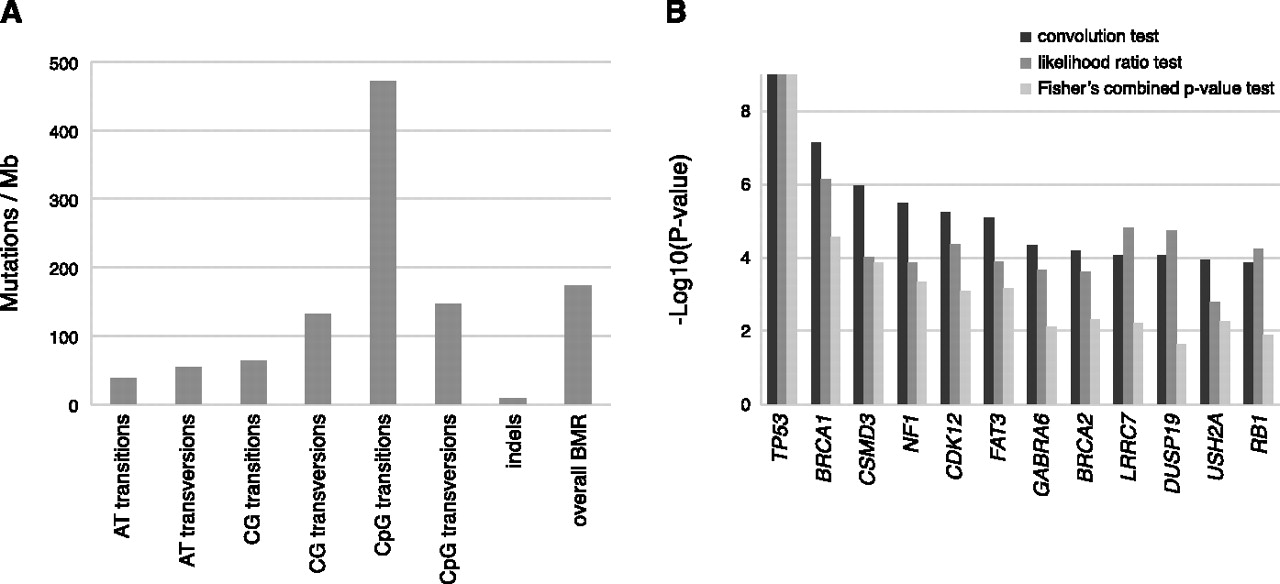
Figure 2.
Mutation rates and SMGs in the OV data set. (A) The cohort-wide background mutation rates for all seven mutational mechanism categories are plotted for the OV data set. The overall BMR is also plotted, combining all types of mutations. (B) −Log10(P) for the top 12 OV SMGs are plotted for all three SMG tests in order of decreasing convolution test P-value.


