
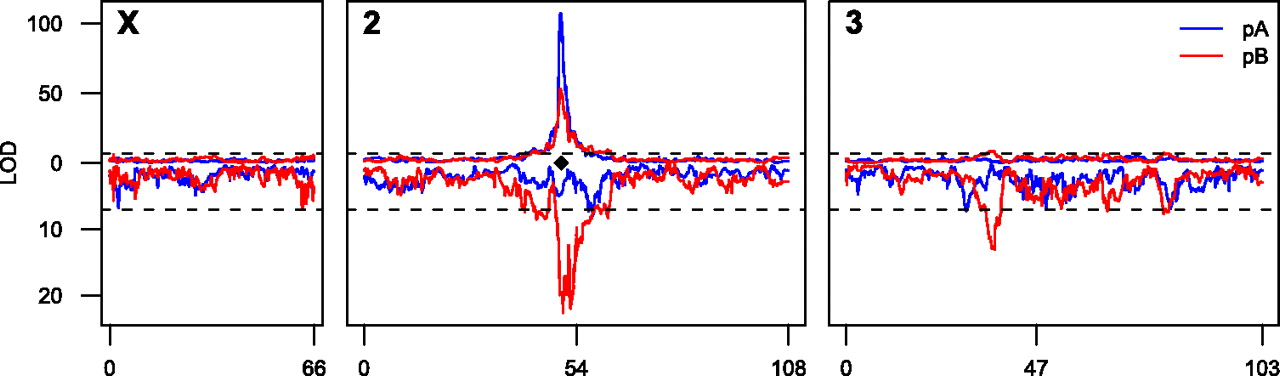
Figure 3.
Positions of loci contributing to variation in ADH activity. QTL identified in analysis of raw ADH activity data (above) and analysis adjusted for Adh polymorphisms F/S and ∇1 (below). (Horizontal dashed lines) QTL significance thresholds determined by permutation. (Black diamond) Position of the Adh locus.


