
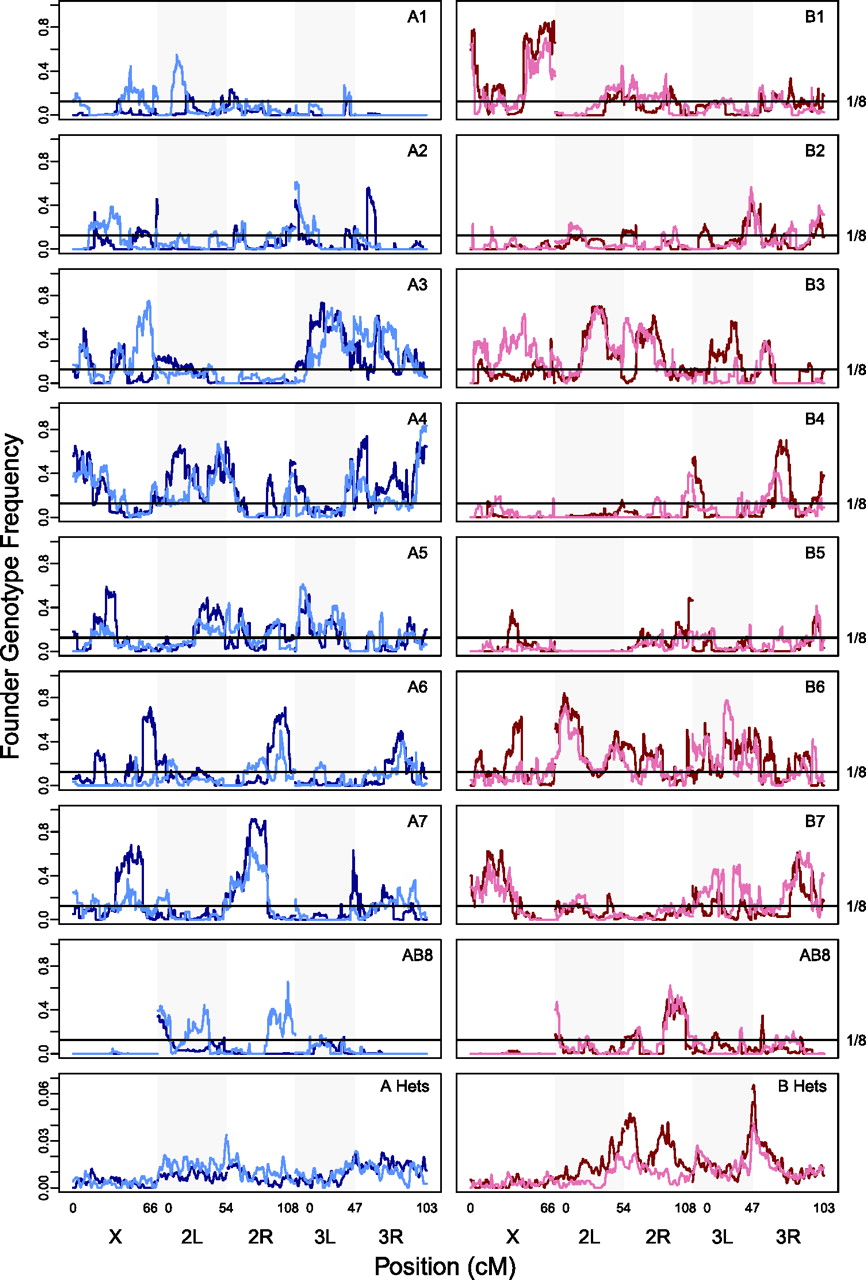
Figure 2.
Founder genotype frequency variation across the genome in the DSPR RILs. The first eight rows show the frequency of each homozygous founder genotype in the pA (pA1, dark blue; pA2, light blue) and pB (pB1, dark red; pB2, pink) DSPR RILs. The 1/8 line shows the expected frequency for equal founder composition. The bottom row shows the frequency of heterozygous genotypes (note the y-axis scale is considerably reduced for these plots).


