
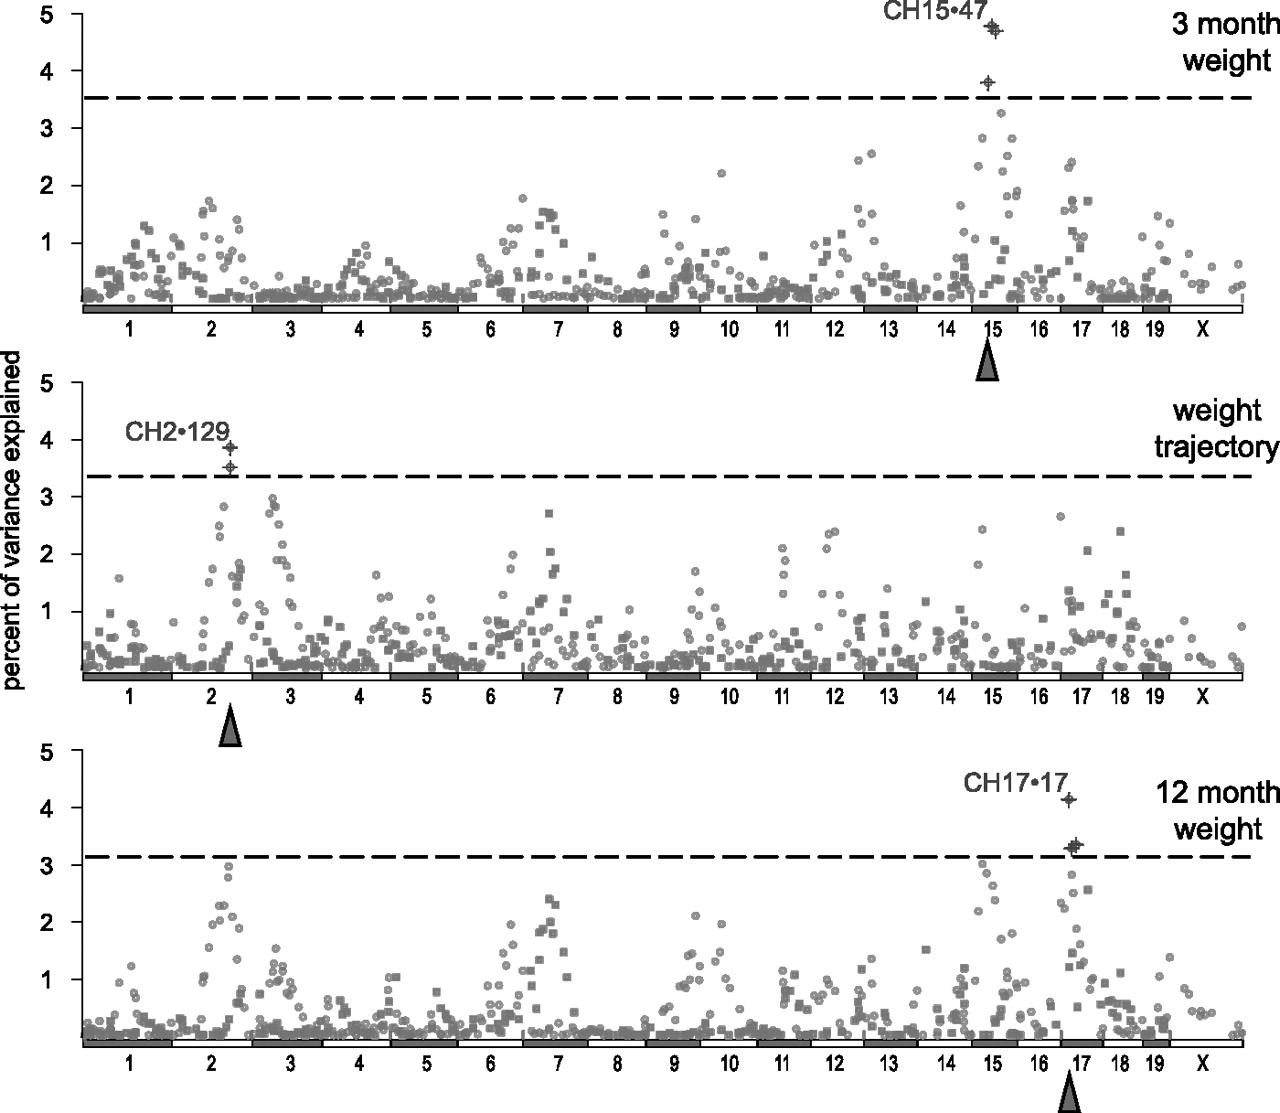
Figure 4.
Genome-wide analysis of adult body weight. Genome-wide association plots of 3-mo weight, adult weight trajectory (3- to 13-mo slope), and 12-mo weight. (Horizontal dashed line) The genome-wide significance level of P < 0.05. (Crossed symbols) The individual loci reaching significance; (triangles) the regional maxima for each measure. (Circles) Maternal-informative loci (BALB/cJ vs. C57BL/6J alleles); (squares) paternal-informative loci (C3H/HeJ vs. DBA/2J alleles).


