
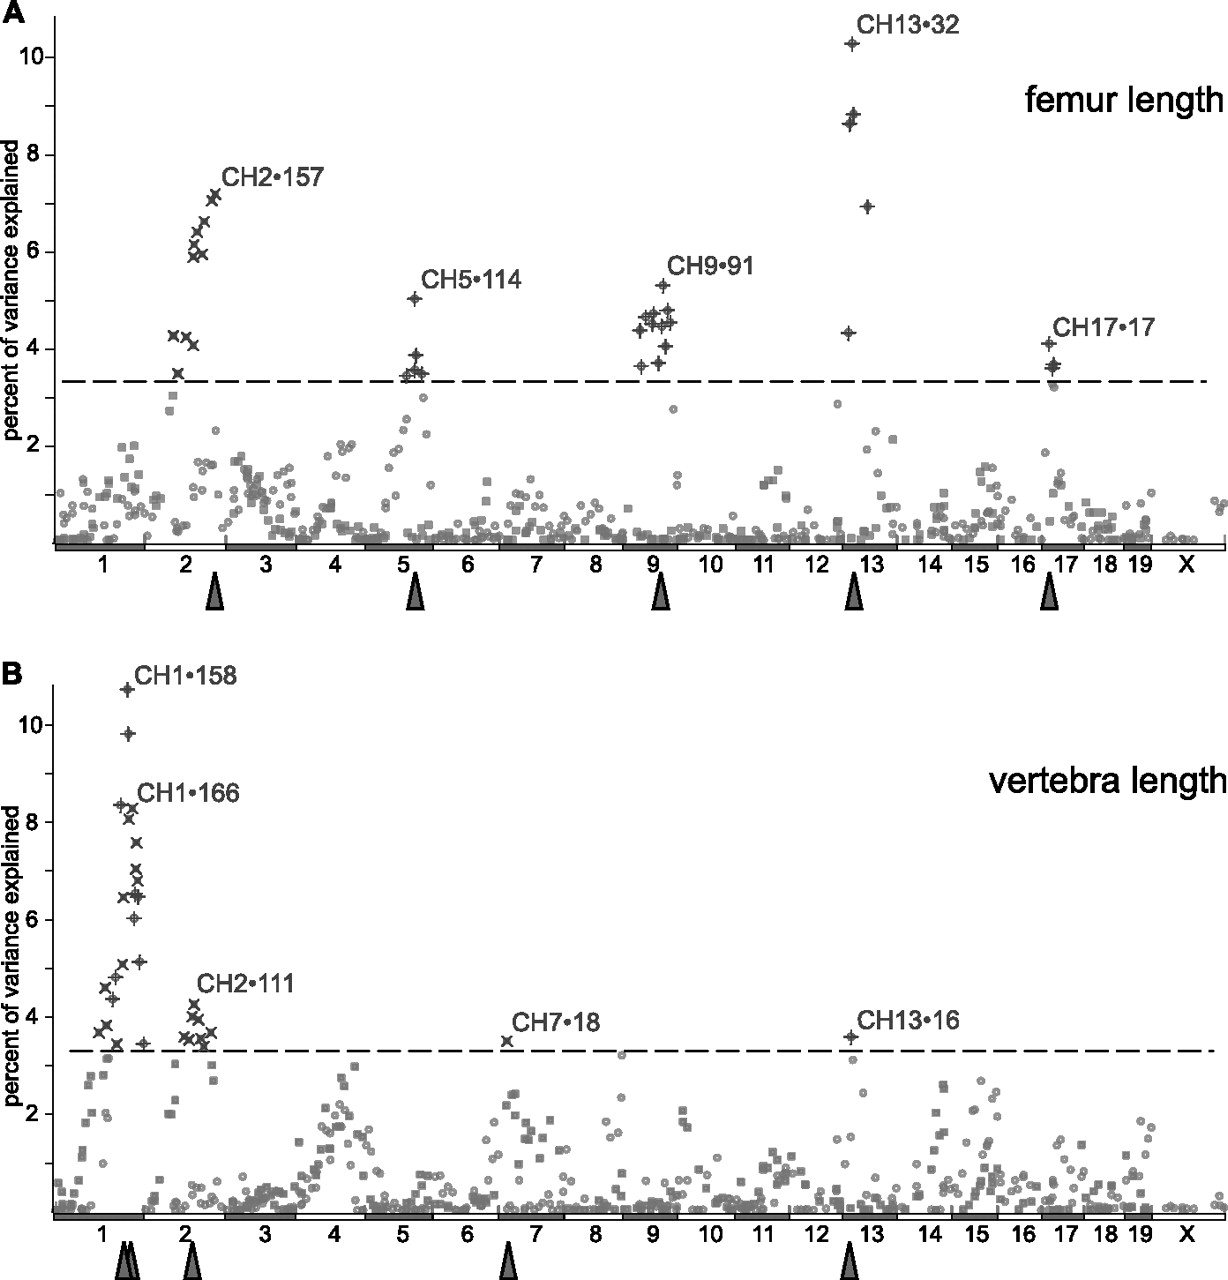
Genome-wide analysis of femur and vertebra length. For each genotyped locus, the display shows the percent of the total measured population variance explained (R2 × 100). (Horizontal dashed line) The genome-wide significance level of P < 0.05. (Crossed symbols) The individual loci reaching significance. In each statistically significant genomic region, the locus with maximal effect is labeled with the chromosome number and distance from the centromere, in megabase pairs (Mb, triangle). (A) Loci associated with right femur length (N = 454). (B) Loci associated with caudal vertebra (C8) length (N = 468). In both panels, (circles) maternal-informative loci (BALB/cJ vs. C57BL/6J alleles); (squares) paternal-informative loci (C3H/HeJ vs. DBA/2J alleles).


