
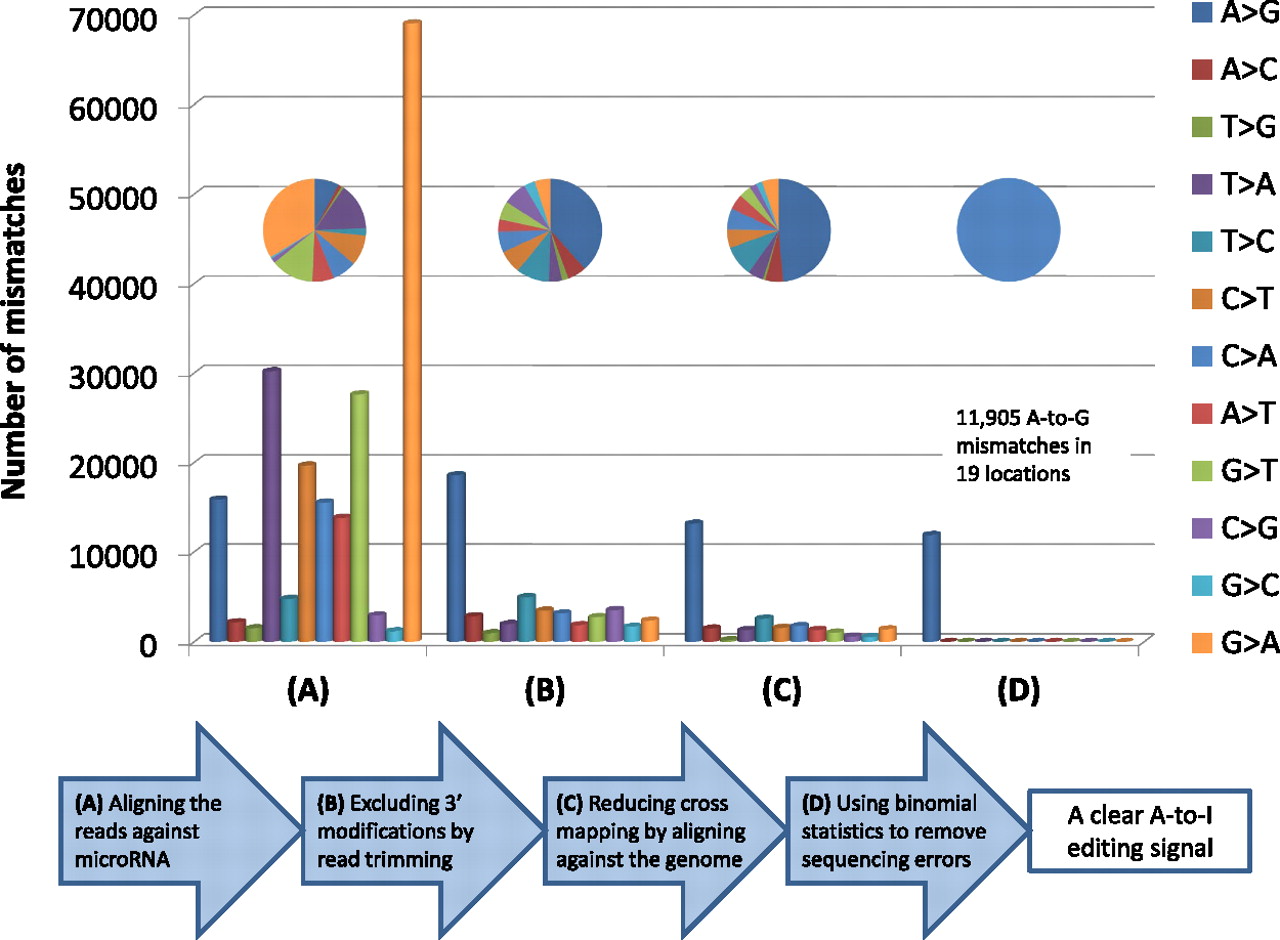
A schematic representation of the procedure for identifying editing sites in mature miRNAs using the brain sample data (for details, see Methods). In each one of the four steps (A–D), the total number of mismatches of any type is given in absolute numbers (bar chart) and in relative proportions (pie chart). (A) If the untrimmed reads are aligned against the known miRNA sequences, a strong signal of adenylation and uridylation is observed. (B) After trimming the 3′ end of the reads, A-to-G modifications become dominant. (C) If the trimmed reads are aligned against the genome and not directly against the miRNA sequences, the relative proportion of the A-to-G mismatches is enhanced as a result of less cross-mapping. (D) After possible sequencing errors are removed by using binomial statistics, only A-to-G modifications are observed.


