
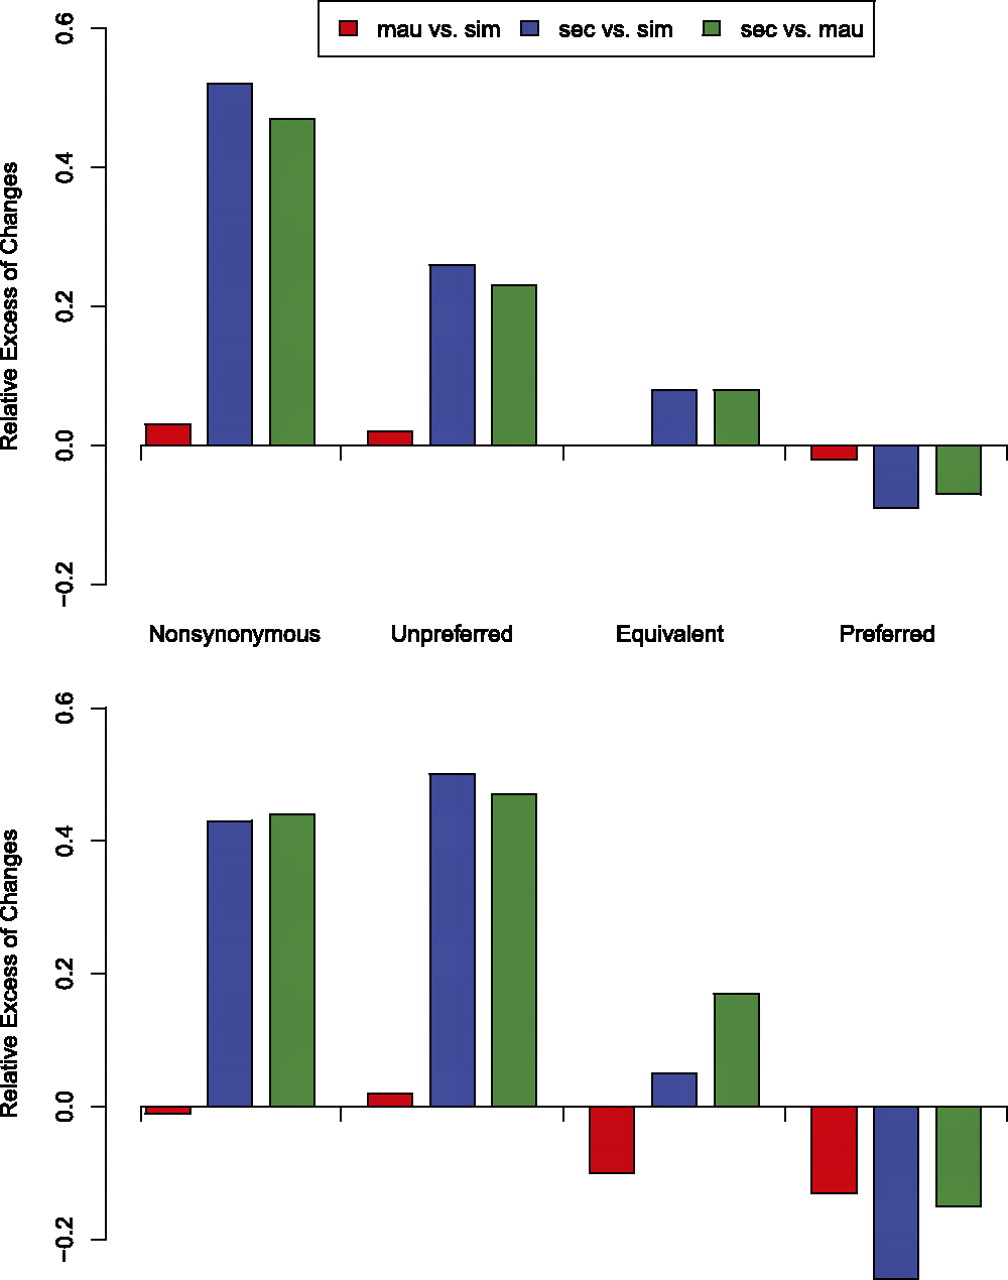
Figure 6.
Relative rates of evolution of four functional classes of mutation. Top panel shows rates for the autosomes, while bottom panel shows rates for the X chromosome. For each pair of species, we calculated the relative excess in the number of changes in species 1 compared with species 2 (see Methods). The functional classes are listed in order of increasing selection coefficient.


