
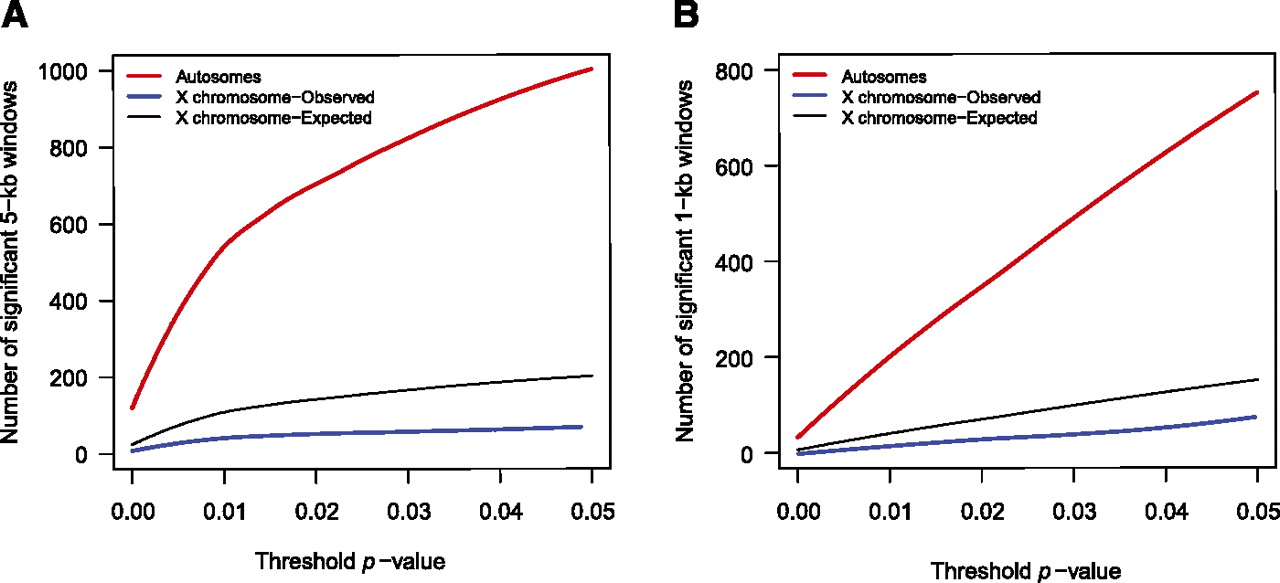
The number of genomic windows that reject the global allopatric model. Results of the likelihood ratio test comparing globally best-fitting allopatric model parameters versus locally best-fitting parameters in both 5-kb windows (A) and 1-kb windows (B) across both the autosomes (red lines) and the X chromosome (blue lines). The number of windows that reject the global model parameters, after correction for multiple tests, is plotted as a function of the threshold P-value that is used to determine significance (see Results section for additional explanation). (Black lines) The expected number of significant windows on the X chromosome, calculated as the product of the number of significant windows on the autosomes and the ratio of the total length of the X chromosome and autosomal alignments. This illustrates a dearth of windows on the X chromosome that are able to reject a strictly allopatric model, given any level of statistical significance.


