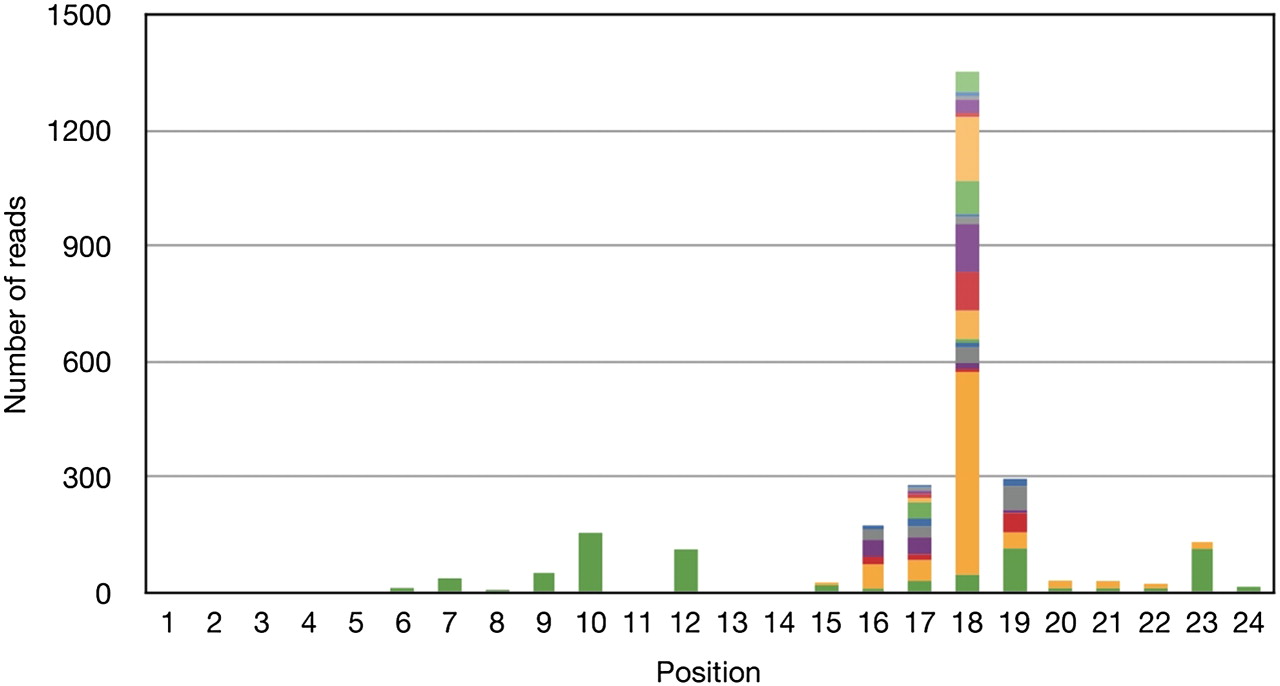
A-to-I editing of microRNAs in the mammalian brain increases during development

(Downloading may take up to 30 seconds. If the slide opens in your browser, select File -> Save As to save it.)

Click on image to view larger version.

Figure 1.
Figure 1.

Bar chart for number of A:G mismatches in miRNA reads at developmental day E15 from SOLiD. The chart shows alignment of the reads against miRBase. Each color band means a species of miRNA. Note that the same color in different bars can represent different species of miRNA.

This Article

  1. Genome Res. 22: 1477-1487

Preprint Server