
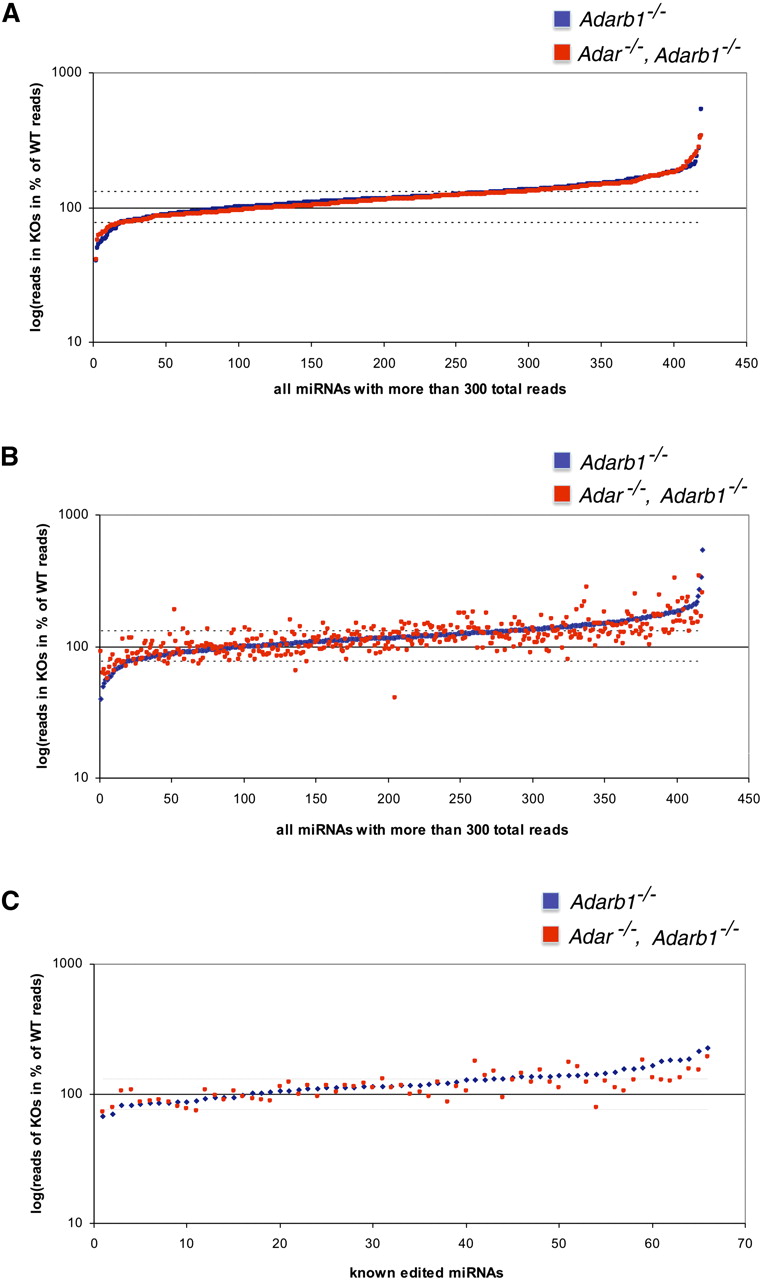
Edited and unedited miRNAs show a similar distribution of relative abundance in Adarb1−/− and Adar−/−, Adarb1−/− embryos. (A) miRNAs with a read depth >300 were sorted according to their relative abundance to wild type (displayed as % of wild-type abundance) in both KO genotypes and plotted on a half-logarithmic scale. miRNAs in Adarb1−/− (blue) and Adar−/−, Adarb1−/− (red) mice. Wild-type expression level is represented by 100, and a threshold of 1.3-fold deregulation is marked by dashed lines. (B) miRNAs shown in A are sorted by their abundance in the Adarb1−/− embryos. (C) miRNAs known from literature to be A-to-I edited were sorted according to their relative abundance in the Adarb1−/− embryos (displayed as % of wild-type abundance). miRNAs in Adarb1−/− (blue) and Adar−/−, Adarb1−/− (red) mice. Wild-type expression level is represented by 100, and a threshold of 1.3-fold deregulation is marked by dashed lines.


