
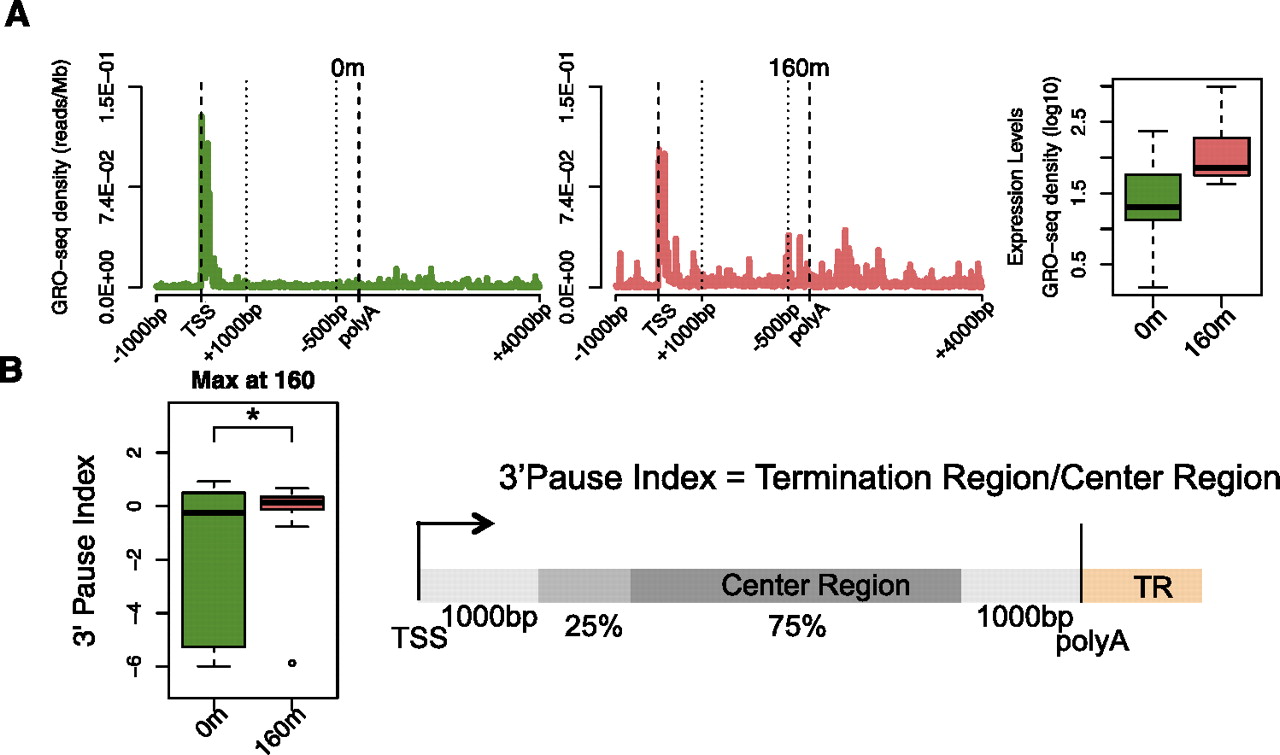
Accumulation of RNAPII at the 3′-end of genes is a dynamic process. (A) Average GRO-seq profiles for 31 estrogen-responsive genes that show maximal up-regulation at 160 min after treatment (Hah et al. 2011). To show the average profiles across genes, a “metagene” profile was plotted. The 5′ end [1 kp upstream of the transcription start site (TSS) to 1 kb downstream] and the 3′-end [500 bp upstream of the poly(A) site to 4 kb downstream] are unscaled. The remainder of the gene is rescaled to 2 kb. The boxplot depicts the expression levels. (B) The 3′ PI was calculated as shown in the schematic using unscaled GRO-seq tag counts from individual genes in each group. The 3′ PI values are significantly different between untreated (green) and estrogen-treated cells (red) as depicted by the boxplots.


