
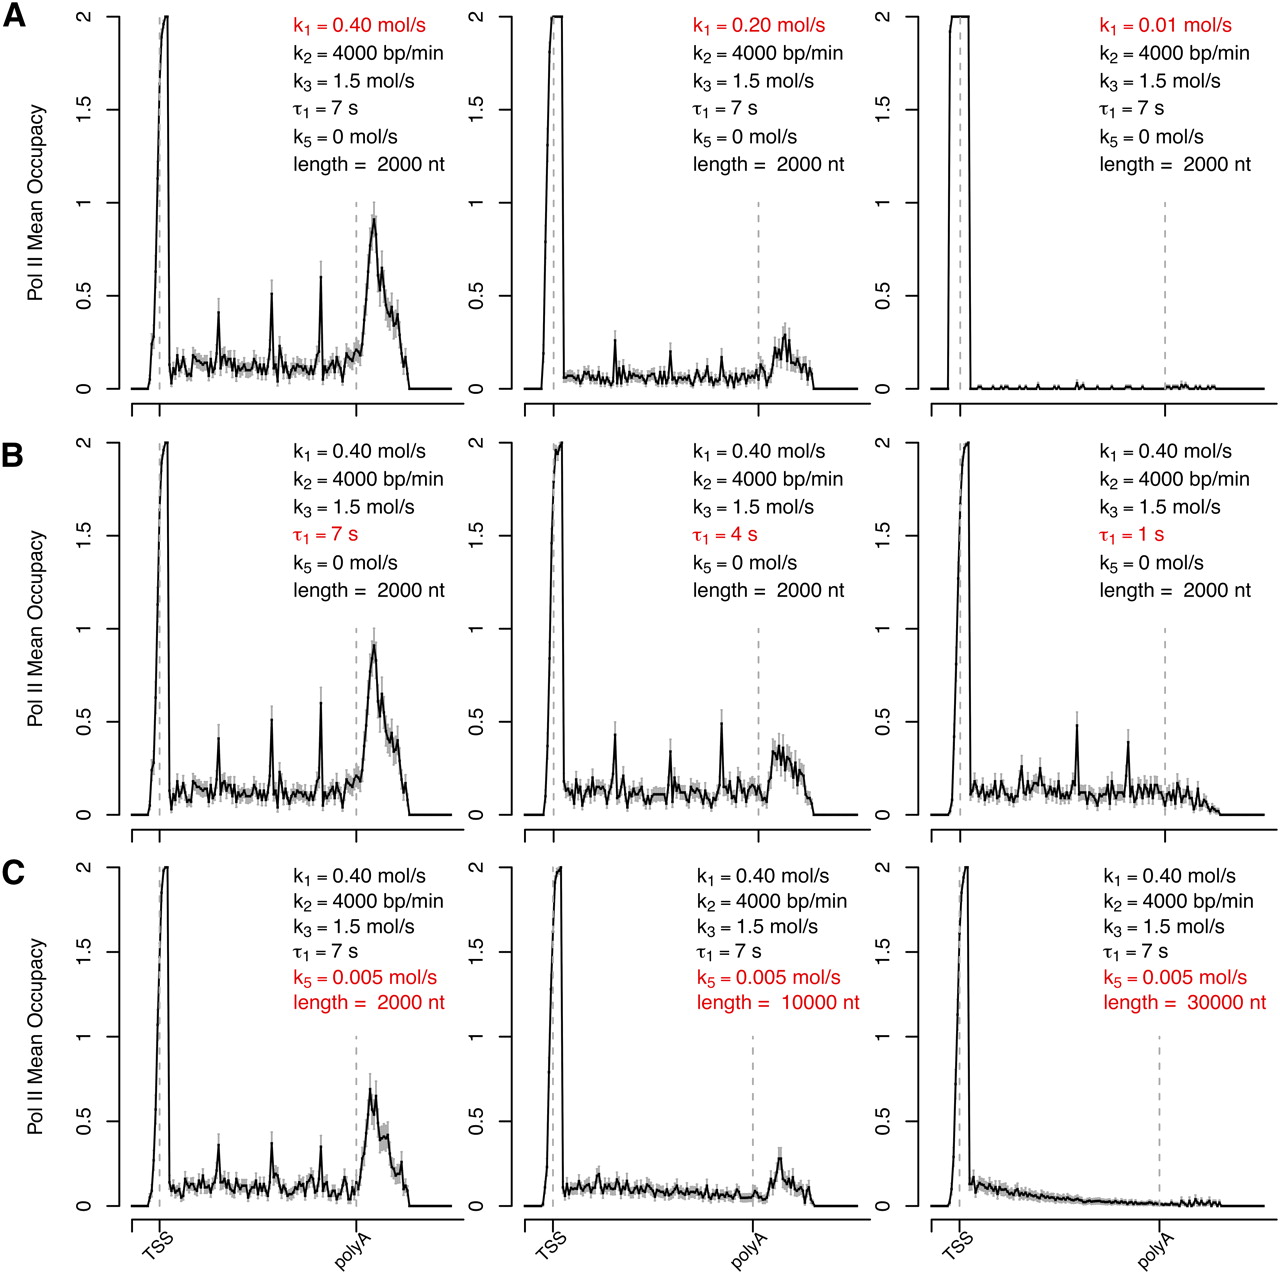
Prediction of RNAPII distribution by stochastic computational modeling. The values of predicted RNAPII density along a hypothetical gene were estimated using the following parameters: promoter-proximal clearance rate (k1), elongation rate throughout the gene body (k2), pausing rate at intragenic sites positioned at a regular distance of 500 nt along the gene body (k3), pausing time downstream from the poly(A) site (τ1), and premature termination rate (k5). (Dashed lines) The positions of TSS and poly(A) site. (A–C) depict a parameter sensitivity analysis: the changes of predicted RNAPII average density profile with variation of either rate of productive transcription (A, reflective of k1); pausing time past the poly(A) site (B, reflective of τ1); and gene length with premature termination (C, reflective of k5).


