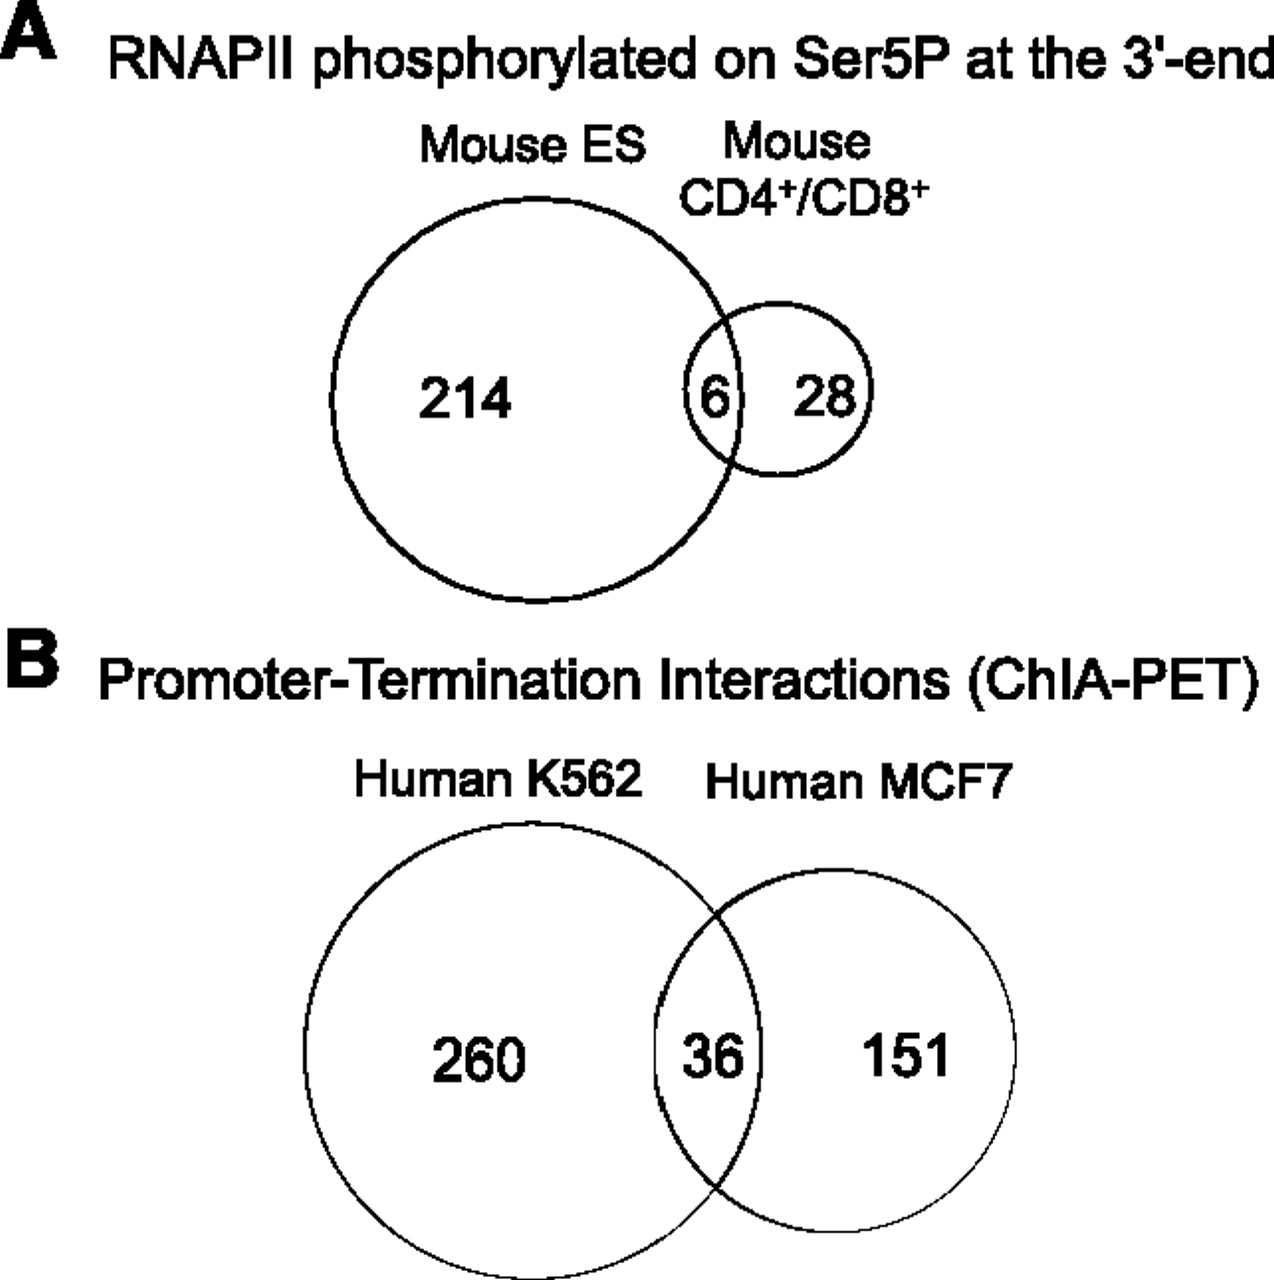
Dynamic transitions in RNA polymerase II density profiles during transcription termination

(Downloading may take up to 30 seconds. If the slide opens in your browser, select File -> Save As to save it.)

Click on image to view larger version.

Figure 2.
Figure 2.

Cell-type specificity of gene looping. Venn diagrams depicting number of genes enriched in RNAPII phosphorylated on Ser5P at the 3′-end (A) and number of genes with intragenic interaction between promoter and termination region identified through ChIA-PET (B).

This Article

  1. Genome Res. 22: 1447-1456

Preprint Server