
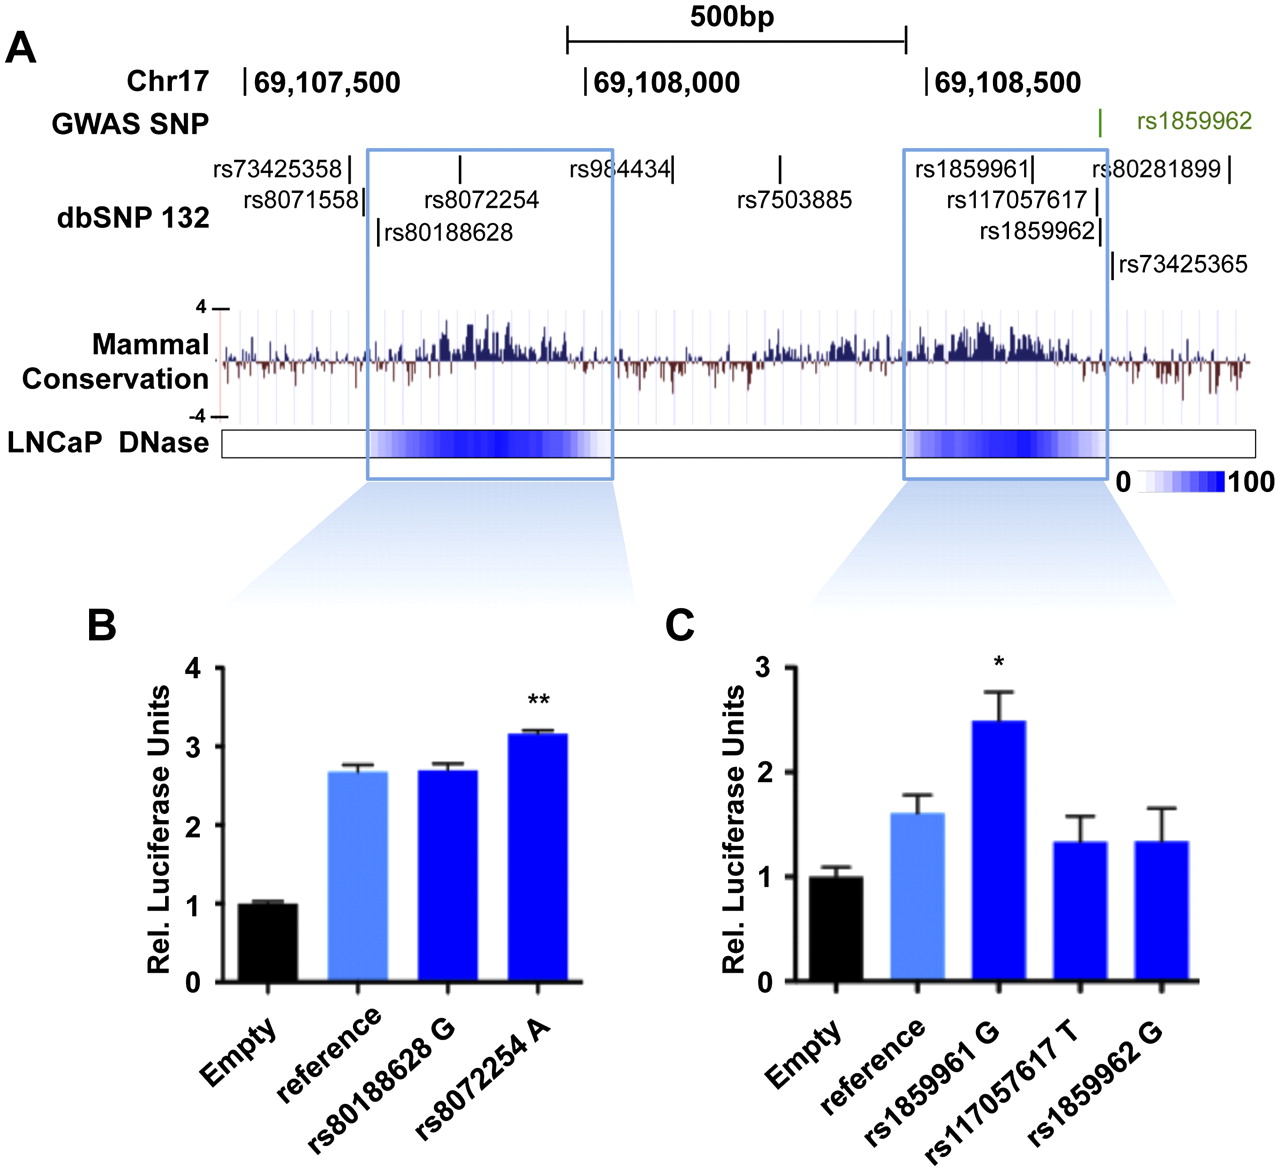
Candidate-functional variants within the E1 enhancer. (A) Overview of the E1 enhancer region. All SNPs from the dbSNP132 database are presented. Five are found in highly conserved regions across mammals (PhyloP value track presented) that map to the two DHS regions found in E1. The mammal basewise conservation score is presented according to their PhyloP value. (B,C) Luciferase assays using plasmids harboring the two DHS regions and either the reference or variant sequence for the five SNPs found within them. The pGL3 plasmid without the enhancer region (Empty) is used as a negative control. (Y-axis) Relative luciferase units normalized to Renilla signal ±1 SEM. The luciferase expression level for each variant SNP is compared with the plasmid homozygous for the reference alleles. The P-value is derived from a t-test; (*) p ≤ 0.05; (**) p ≤ 0.01.


