
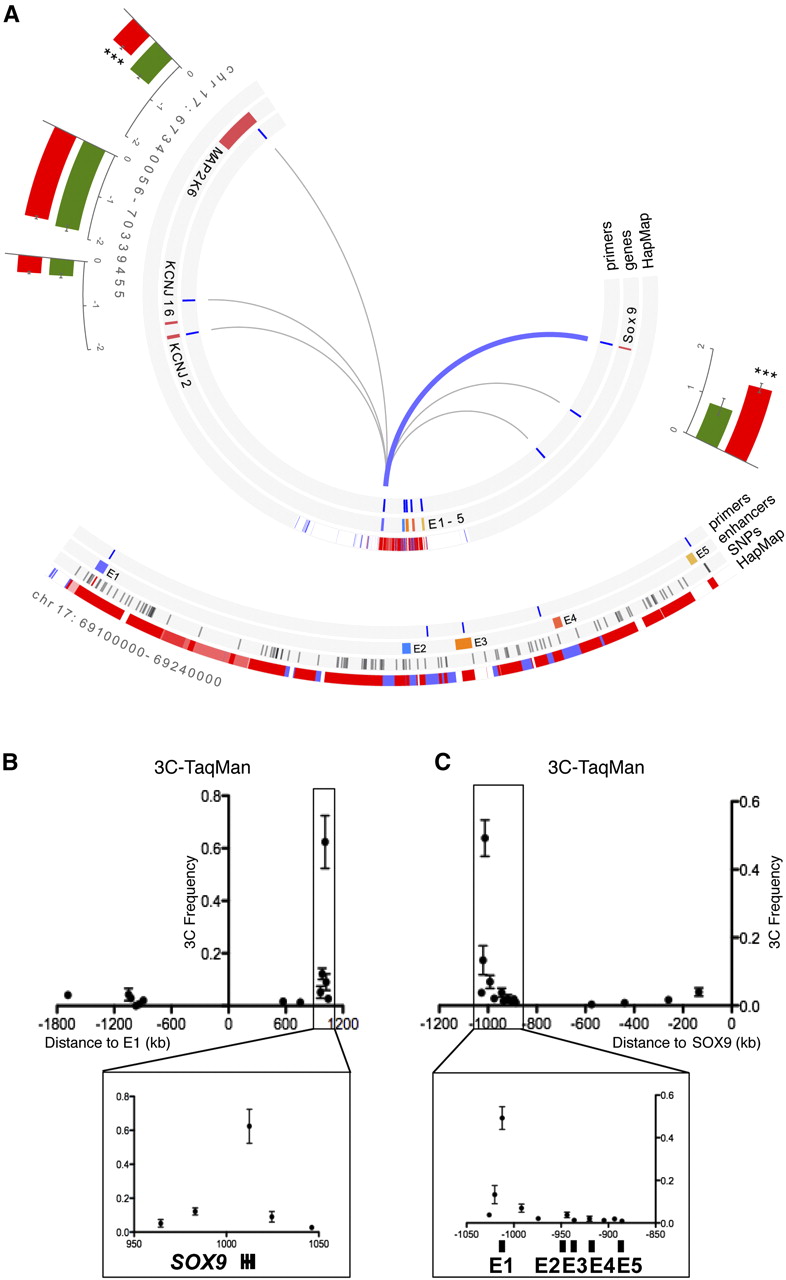
The E1 enhancer is connected to the SOX9 gene through a 1-Mb chromatin loop. (A) Circular representation of the 3-Mb DNA region surrounding the 17q24.3 risk locus. From inner to outside: chromatin loops identified by TaqMan probe–based 3C-qPCR in LNCaP cells (lines correspond to tested loops). (Blue) A detected loop; (gray) undetected loops. Locations of 3C primers, genes and enhancers, the LD block defined by the International HapMap Project for the rs1859962, and population expression level of nearby genes; (green) normal prostate epithelium; (red) primary prostate tumors. For gene expression, the y-axis represents the individual log2 expression level ±1 SEM. Expression levels from prostate tumors are compared with normal samples. The P-value is derived from a t-test; (***) p ≤ 0.001. Note the negative level of MAP2K6, KCNJ16, and KCNJ2 expression. (Bottom panel) Zooms into the LD block associated with rs1859962 (red bar) defining the SNPs in LD (black bars). LD score: (dark red) LOD = 2, D′ = 1; (light red) LOD = 2, D′ < 1; (blue) LOD < 2, D′ = 1; (white) LOD < 2, D′ < 1. (B) 3C-TaqMan assays with a TaqMan probe targeting the E1 enhancer. (X-axis) Genomic distance from each 3C test site to the E1 enhancer. (Y-axis) 3C interaction frequency. The SOX9 gene region is highlighted in the bottom panel. (C) Same as B but with regard to a TaqMan probe targeting the SOX9 gene. The 17q24.3 PCa risk LD block is highlighted in the bottom panel.


