
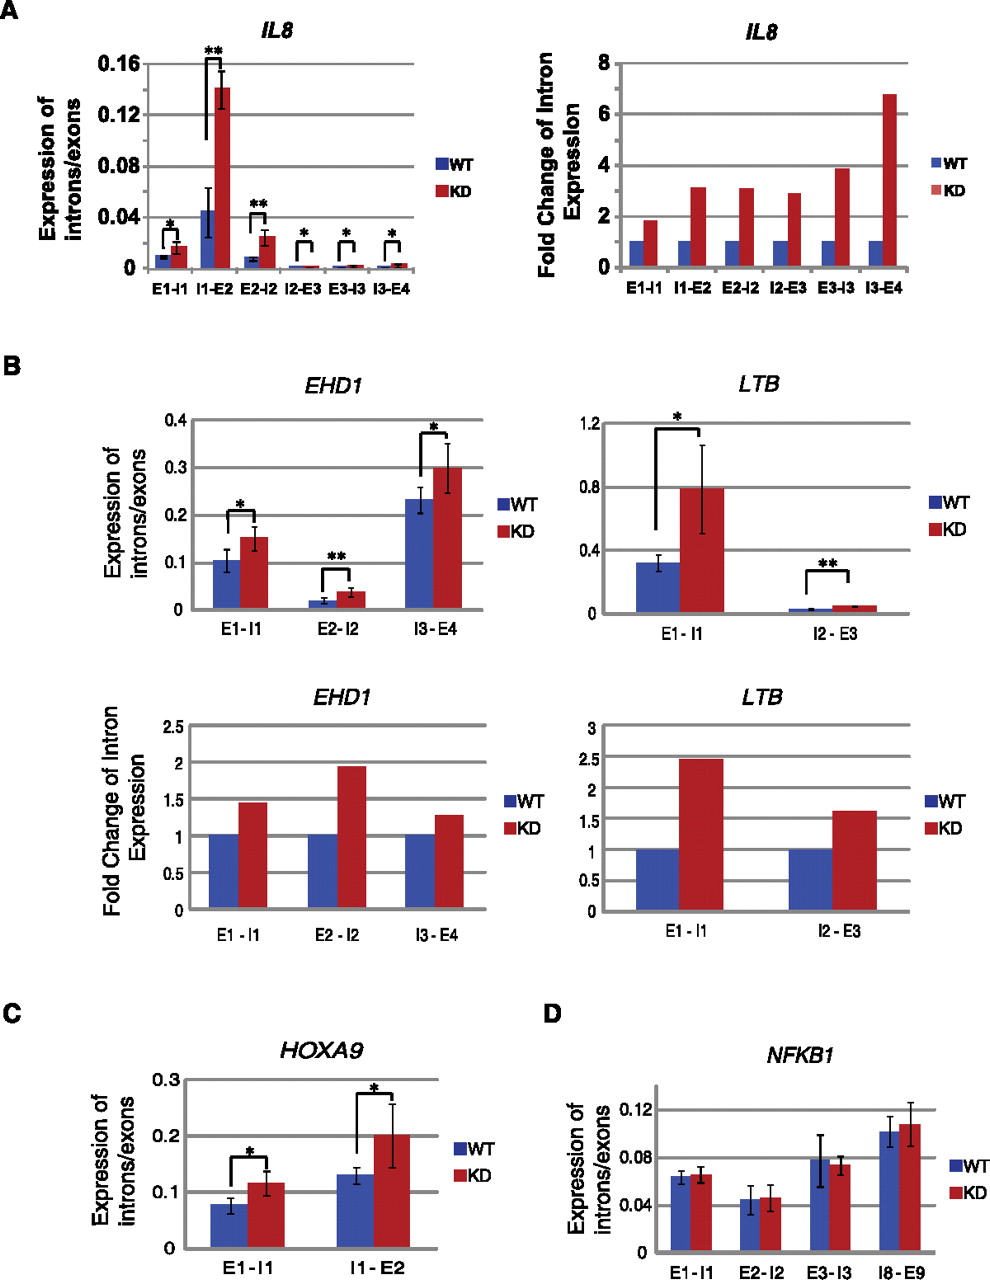
Depletion of CBX3 causes a decrease in splicing only at CBX3 target genes. (A–D) RT-qPCR analysis of intron/exon expression ratios for intron–exon boundaries across candidate genes. The ratio was calculated by dividing intron expression, from intron–exon junction primer set, by exon expression, from intron spanning primer set. (A,B,D) RNA isolated from WT or KD HCT116 cells treated with TNF for 30 min. (C) RNA isolated from untreated WT and KD cells. (A, left) Intron/exon expression ratios for all intron–exon boundaries across the IL8 gene. (Right) Fold change of intron/exon expression over WT for left panel. (B, top) Intron/exon expression ratios for TNF-responsive, CBX3 target genes EHD1 and LTB. (Bottom) Fold change of intron expression over WT. (C) Intron/exon expression ratios for HOXA9. (D) Intron/exon expression ratio for NFKB1, a TNF-responsive, non-CBX3 target gene. Expression levels of all samples were normalized to GAPDH and are the average of at least three biological replicate experiments. Error bars calculated as the standard deviation between replicates. (*) P ≤ 0.05, (**) P ≤ 0.01.


