
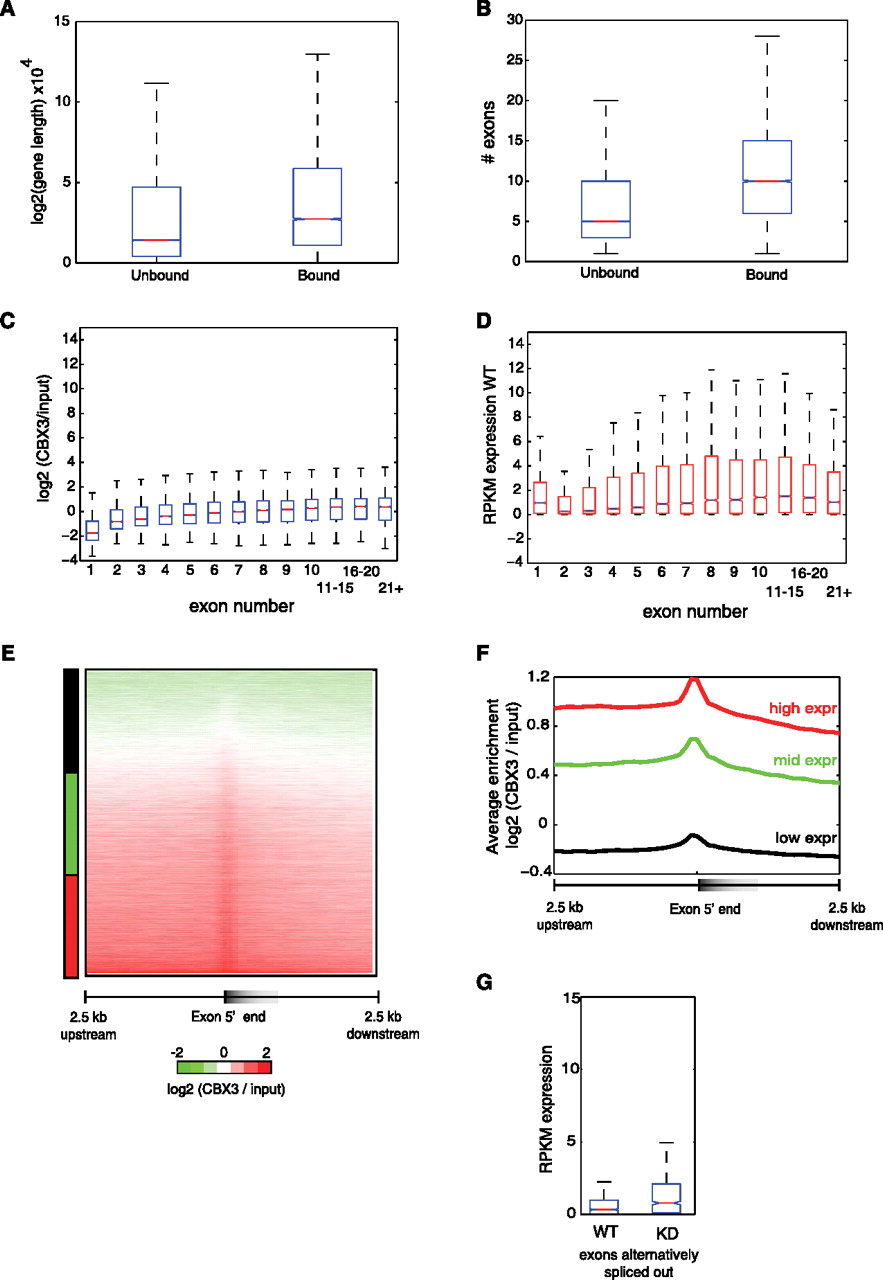
CBX3 binds to longer, exon-rich genes. (A) Box plot of Log2(gene length) of CBX3 bound or unbound genes in WT HCT116 cells. P = 4.77 × 10−283. (B) Box plot of median exon number for CBX3 bound and unbound genes. P = 1 × 10−300. (C) Box plot of CBX3 enrichment, log2 (CBX3/input), for genes grouped by exon number from 1 to 21+. (D) Box plot showing RPKM expression, in WT cells, of genes grouped by exon number from 1 to 21+. (E) Heatmap of CBX3 enrichment 2.5 kb upstream of and downstream from TSS distal exons in WT HCT116 cells. Signal normalized to input and targets clustered by exon expression from lowest to highest. (F) Average CBX3 enrichment at high (red), middle (mid-green), and low (black) third expressed exons. (G) Comparison of RPKM expression for alternatively spliced exons (alt out) in WT and KD cells. P-value for “alt out” exon in WT versus KD 2.771 × 10⁻¹⁵. For box plots, the median is represented by the center line; the edges of the box represent the 25th and 75th percentiles; and the whiskers extend to non-outlier extreme data points. P-values obtained using the Wilcoxon rank sum test.


