
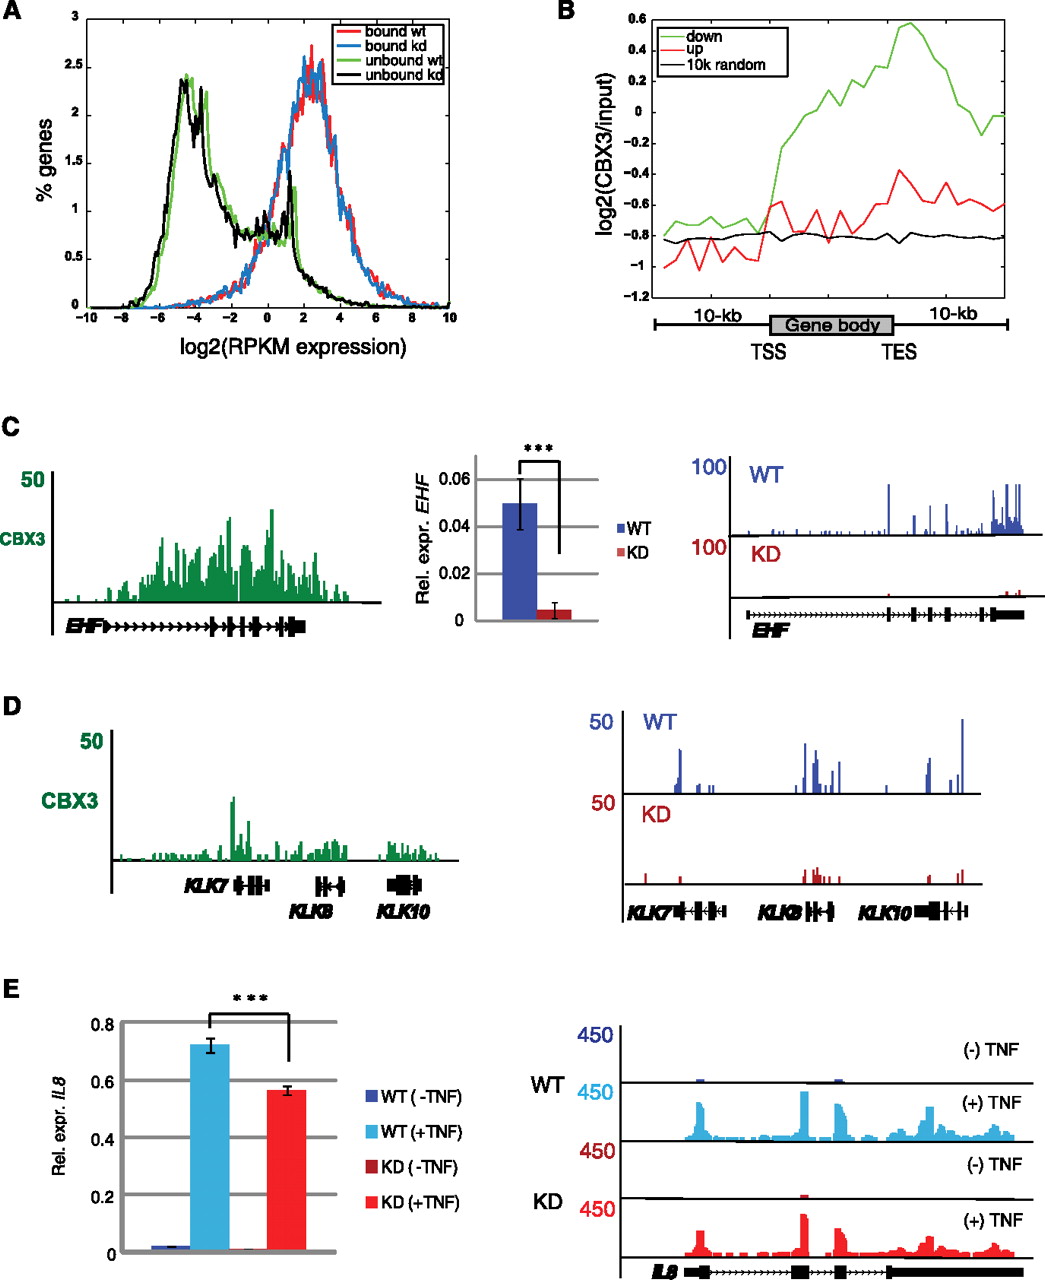
CBX3 target genes are down-regulated in KD HCT116 cells. (A) Comparison of Log2 (RPKM expression) profiles for genes in KD and WT cells, grouped as either bound or unbound by CBX3 (in WT cells). Bound WT red line, bound KD blue line, unbound WT green line, and unbound KD black line. (B) CBX3 enrichment, from WT cells, for genes up- or down-regulated in CBX3 KD HCT116 cells. Log2 CBX3 (IP/input), from CBX3 ChIP-seq in WT HCT116 cells, binned as in Figure 1B with random regions as a control. (C, left) ChIP-seq UCSC Genome Browser snapshot of CBX3 enrichment at the EHF gene. (Middle) RT-qPCR analysis of EHF expression in WT and KD HCT116 cells. (Right) RNA-seq UCSC Genome Browser snapshot of EHF expression level in WT and KD cells. (D, left) CBX3 binding. (Right) RNA-seq browser shot (as in C) for KLK gene cluster. (E, left) RT-qPCR analysis of TNF-responsive CBX3 target IL8 in KD and WT HCT116 cells treated ± TNF for 30 min. (Right) UCSC Genome Browser snapshot of RNA-seq IL8 expression. RT-qPCR expression levels normalized to GAPDH and are the average of three biological replicate experiments. Error bars calculated as the standard deviation between replicates. (***) P ≤ 0.001.


