
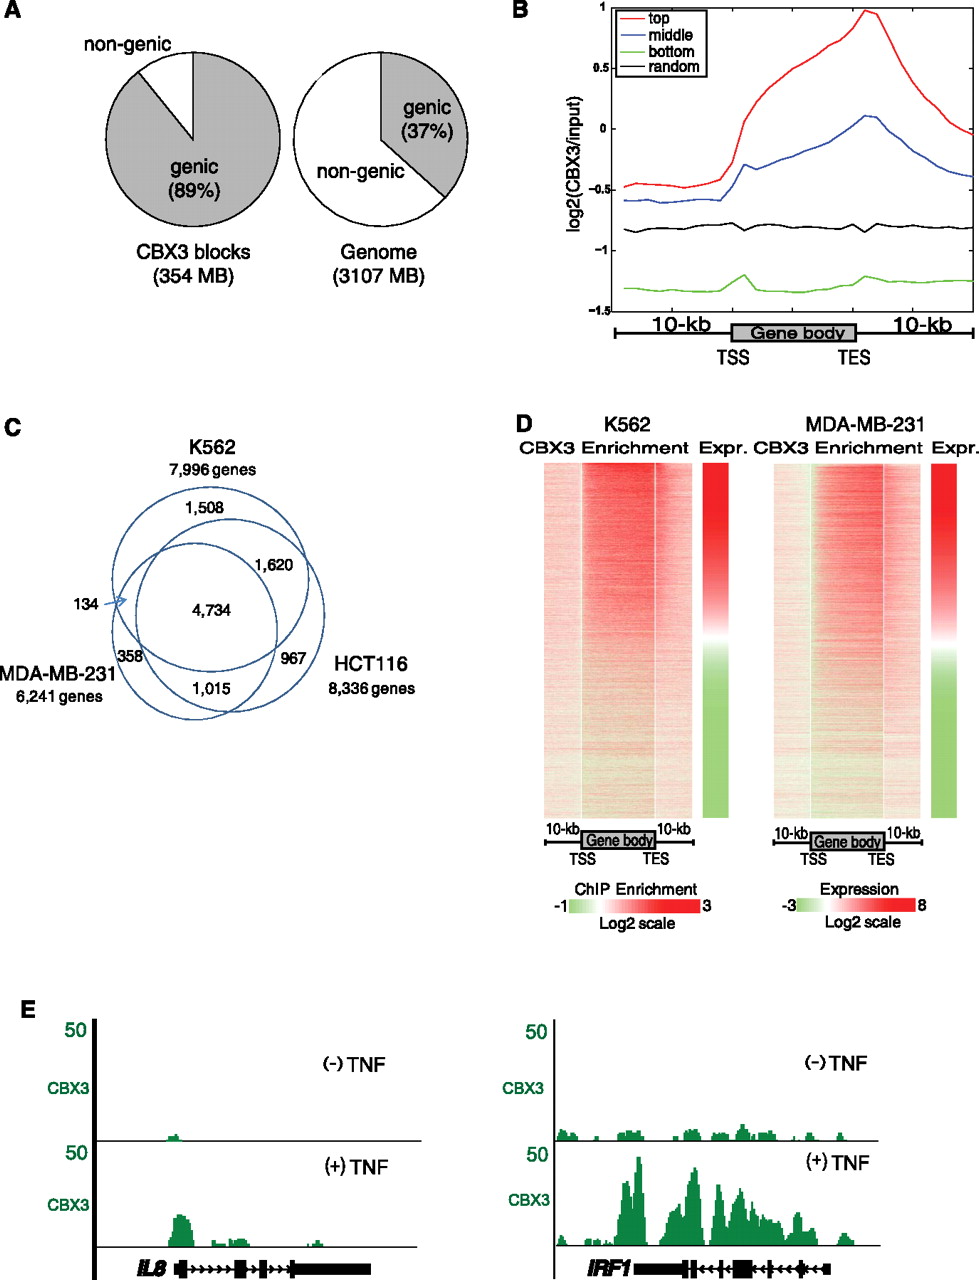
CBX3 localization to gene bodies correlates with gene expression in multiple cell types. (A) Distribution of ChIP-seq CBX3 targets between genic and nongenic regions in HCT116 cells. (B) Enrichment of CBX3 to top, middle, and bottom third expressed genes from 10 kb upstream to 10 kb downstream from gene body. Average enrichment in 500-bp bins every 1 kb. Random region included as a control. (C) Venn diagram showing the overlap of ChIP-chip (NimbleGen arrays) CBX3 targets between K562, MDA-MB-231, and HCT116 cells. CBX3 target genes are called for each cell type based on whether they have CBX3 peaks within their gene bodies. (D) Log transformed expression levels, from Affymetrix arrays, for K562 and MDA-MB-231 genes clustered from highest to lowest expression (Expr.). Heatmap of CBX3 enrichment, by ChIP-chip, for clustered genes, from 10 kb upstream of the transcription start site (TSS) to 10 kb downstream from the transcription end site (TES). For each gene we divide the gene body into 50 equal divisions and use the log2 ratio of the nearest probe on the microarray to estimate the binding strength for every boundary position between these divisions. (E) ChIP-seq data visualized in UCSC browser snapshots showing CBX3 localization to the IL8 and IRF1 genes, in HCT116 cells treated ± TNF for 30 min.


