
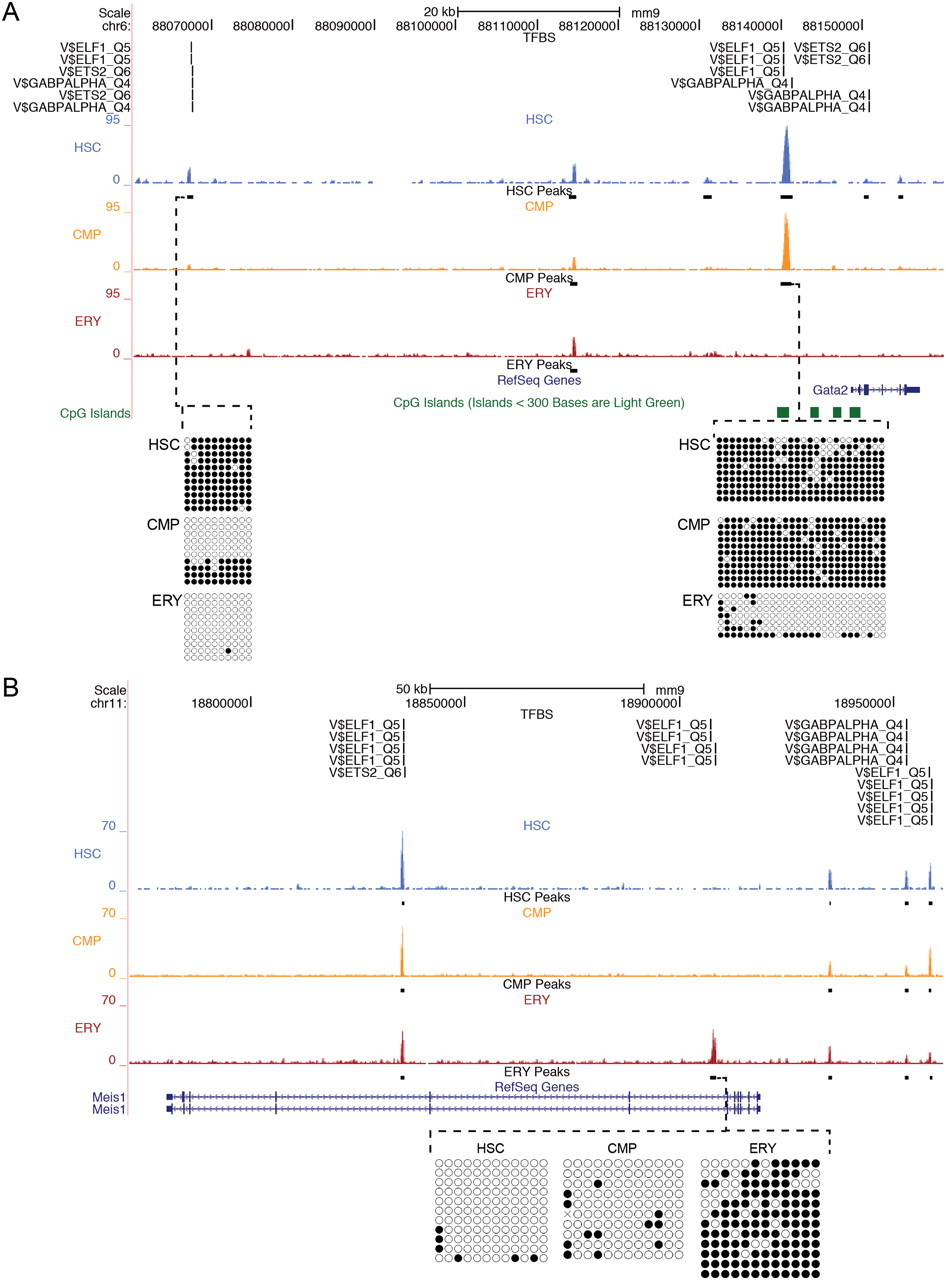
MBD-seq peaks at selected loci. UCSC Genome Browser view of the Gata2 locus on Chr6 (A) and the Meis1 locus on Chr11 (B). Raw sequencing data for each cell population: blue (HSC), orange (CMP), and red (ERY), with significant peaks shown as black bars below each sample. The y-axis indicates peak height, defined by the maximum number of sequencing tags seen in the highest visible peak in each window. Transcription factor consensus sites (TRANSFAC IDs) are indicated above the MBD-seq data in regions of significant peaks. The gene structure is indicated below the MBD-seq data with CpG islands shown in green. Bisulfite sequencing data confirming the cell-type-specific methylation are shown below. (Black circles) Methylated CpG sites; (open circles) unmethylated CpG sites. Each horizontal line indicates a unique clone.


