
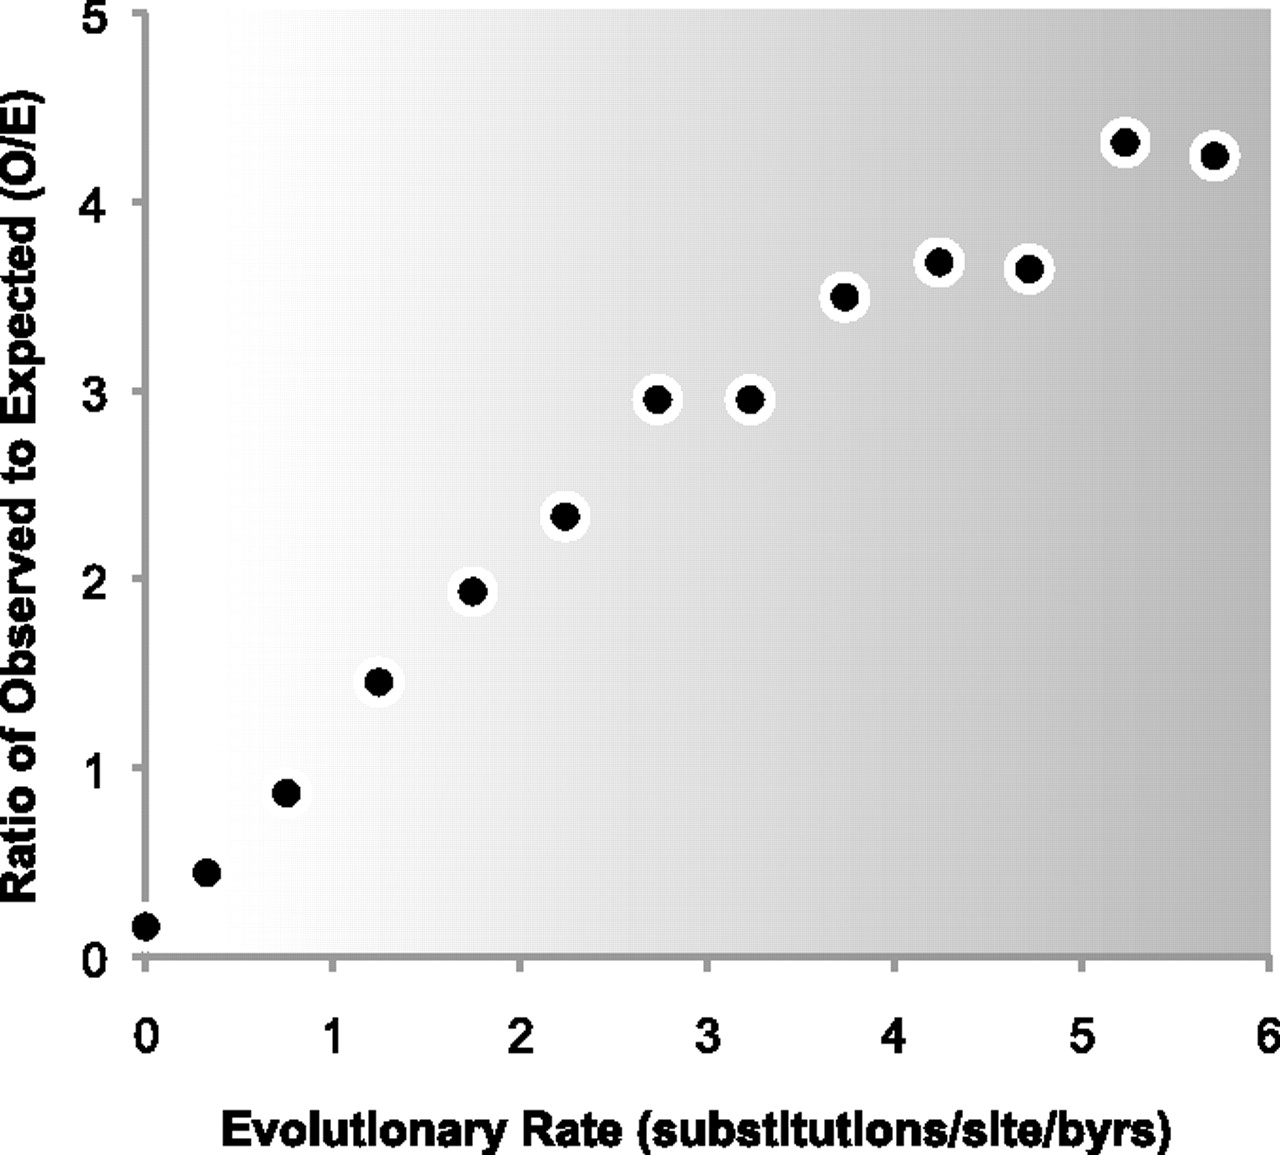
The ratio of observed to expected (O/E) numbers of personal exome variants (nonsynonymous, nSNVs) found in positions with higher to lower degrees of evolutionary conservation (slow to fast evolutionary rates). There is an underabundance of nSNVs in slow evolving positions (O/E < 1; lighter background) and an overabundance at fast evolving positions (O/E > 1; darker background). A linear regression model fits the observed data well (R2 > 0.95), which denotes a decrease in the strength of natural selection with the increasing evolutionary rate, as expected under the neutral theory. Sequences of eight HapMap exomes (Ng et al. 2009) were used to generate the figure, based on evolutionary rates estimated using 46 species alignment of vertebrates and lamprey from the UCSC Genome Browser resource (Kumar et al. 2009; Fujita et al. 2011).


