
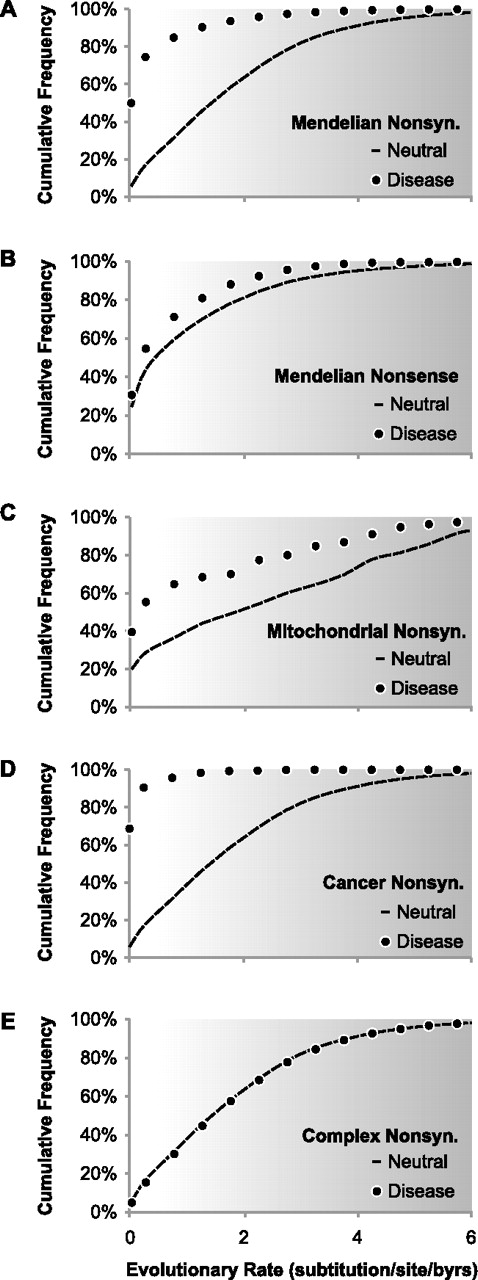
The cumulative frequency distribution of disease-associated variants (closed circles) and population polymorphisms (dashed lines) over long-term evolutionary substitution rates, with darker background indicating increasing evolutionary variability. (A) Nonsynonymous variants associated with Mendelian diseases; 39,578 variants from HGMD are shown (Stenson et al. 2009). (B) Nonsense variants associated with Mendelian diseases; 2806 variants from HGMD are shown. (C) Nonsynonymous variants in human mitochondrion associated with diseases; 190 disease-associated and 964 polymorphic variants from MITOMAP are shown (Ruiz-Pesini et al. 2007). (D) Nonsynonymous somatic mutations associated with cancers; 1207 driver variants from CanPredict are shown (Kaminker et al. 2007). (E) Nonsynonymous variants associated with complex diseases; 8644 variants from VARIMED are shown (Chen et al. 2010). These distributions show that protein positions harboring disease-associated variants tend to evolve at a much slower rate (lighter background) than positions harboring population polymorphisms. This pattern is the most distinct for nonsynonymous variants associated with Mendelian diseases, cancers, or mitochondrial diseases. The distinction becomes less obvious for nonsense variants, and the pattern completely disappears for nonsynonymous variants associated with complex diseases, the latter of which are expected to exhibit a neutral evolutionary pattern due to their modest effects on fecundity. Evolutionary rates in panels A, B, D, and E are estimated using multiple alignments of orthologs from 46 species (Fujita et al. 2011) following the procedure in Kumar et al. (2009). For panel C, amino acid sequence alignments for mitochondrial proteins were obtained for 28 mammalian species from MamMiBase (Vasconcelos et al. 2005) and the evolutionary rate was estimated following Kumar et al. (2009).


