
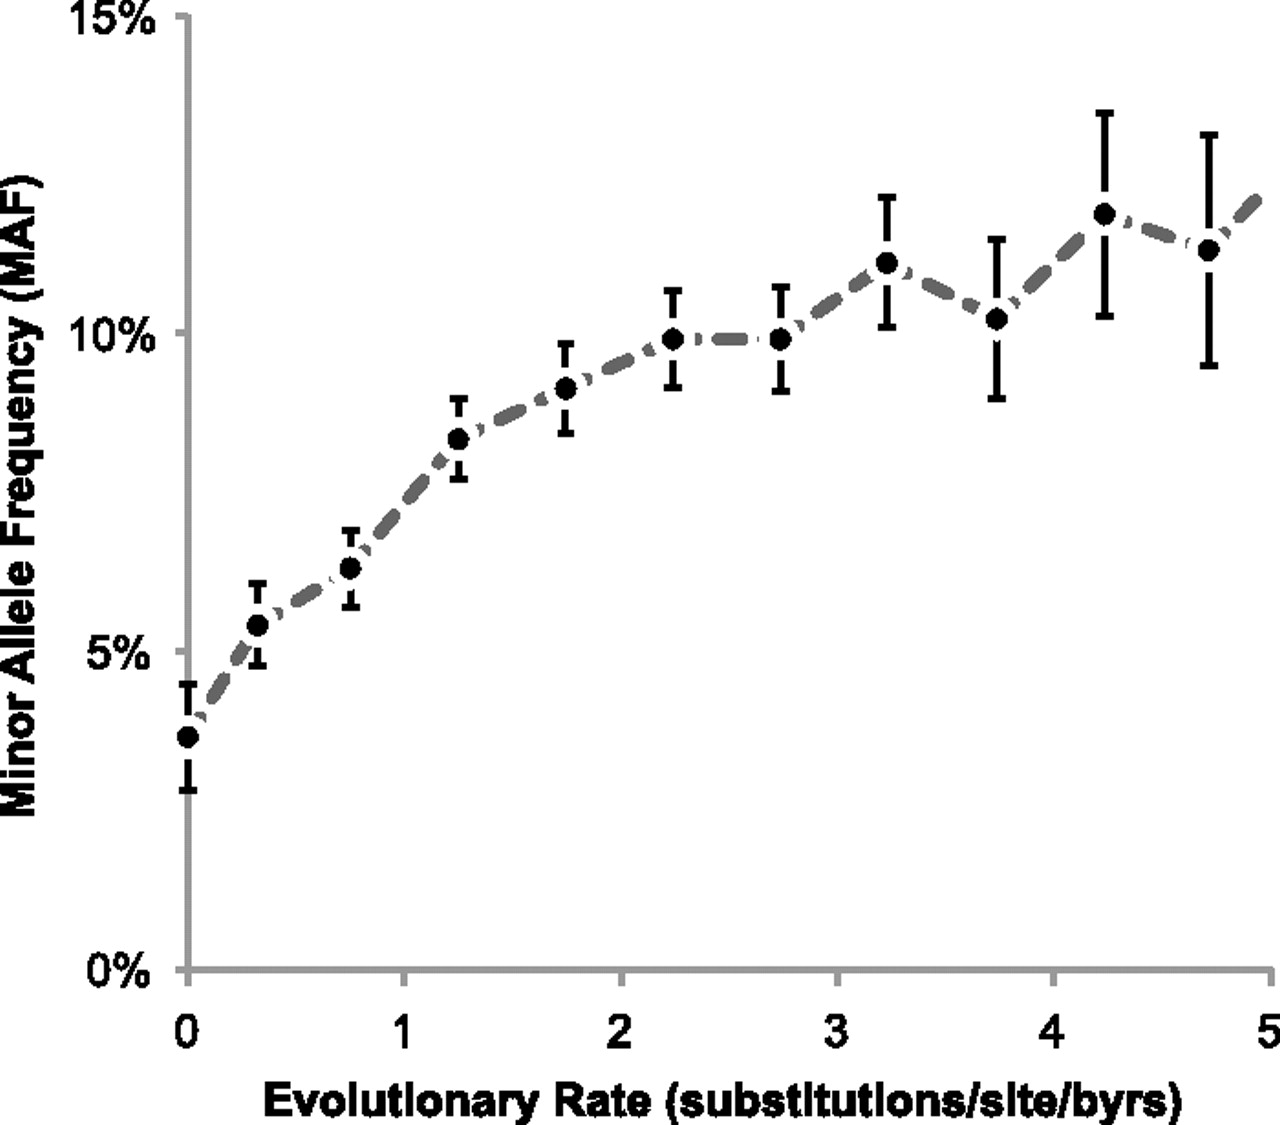
Figure 3.
Relationship between the cross-species evolutionary rate and minor allele frequency (MAF) for nSNVs. Slower-evolving positions host nSNVs with the lower MAFs, on average. MAFs for 15,043 neutral nSNVs from the HumVar data set were obtained for one HapMap population (CEU) (The International HapMap 3 Consortium 2010). Long-term evolutionary rates were estimated using the protein sequence alignment from the UCSC Genome Browser resource (Kumar et al. 2009; Fujita et al. 2011). For each evolutionary rate category, the median MAF is plotted along with error bars (2 SEM).


