
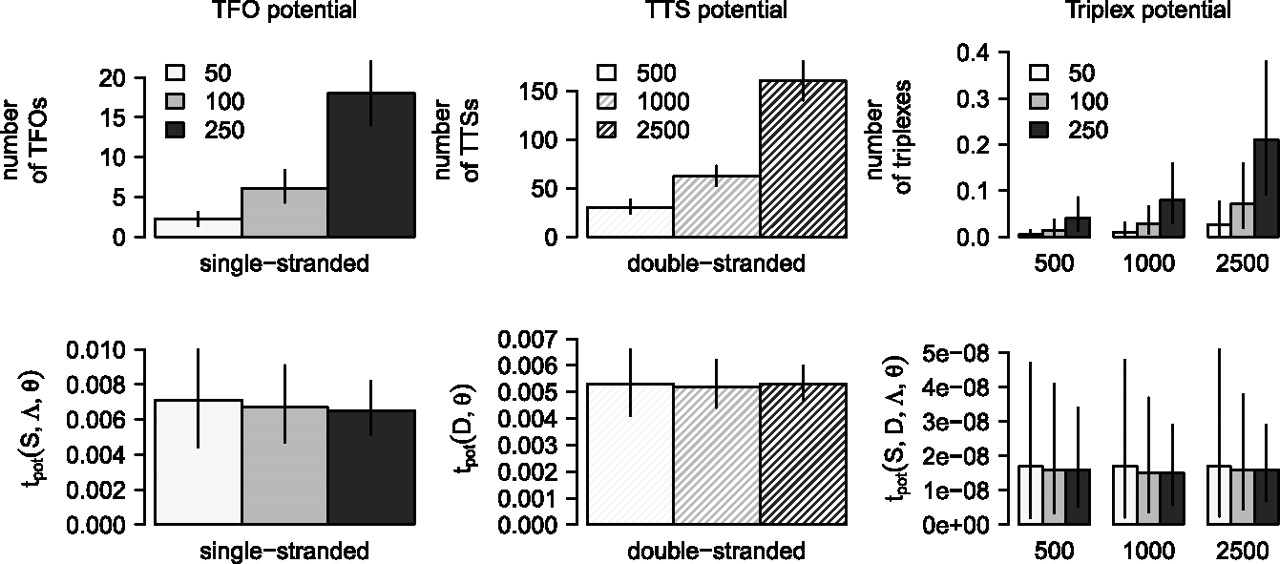
Figure 8.
Effect of sequence length normalization using random data. The plots show the accumulated triplex potential of single-stranded sequence sets (left), double-stranded sequence sets (middle), and between both sets of sequences (right) either counting the number of triplex features (upper panel) or using a length-adjusted scoring scheme (lower panel) with lines indicating the 90% confidence intervals. All sequence sets are derived from the same 107 nucleotide sequence but partitioned into sets of varying length distribution as indicated by the mean sequence length m ∈ {50, 100, 250} for single-stranded and m ∈ {500, 1000, 2500} for double-stranded sequence sets.


