
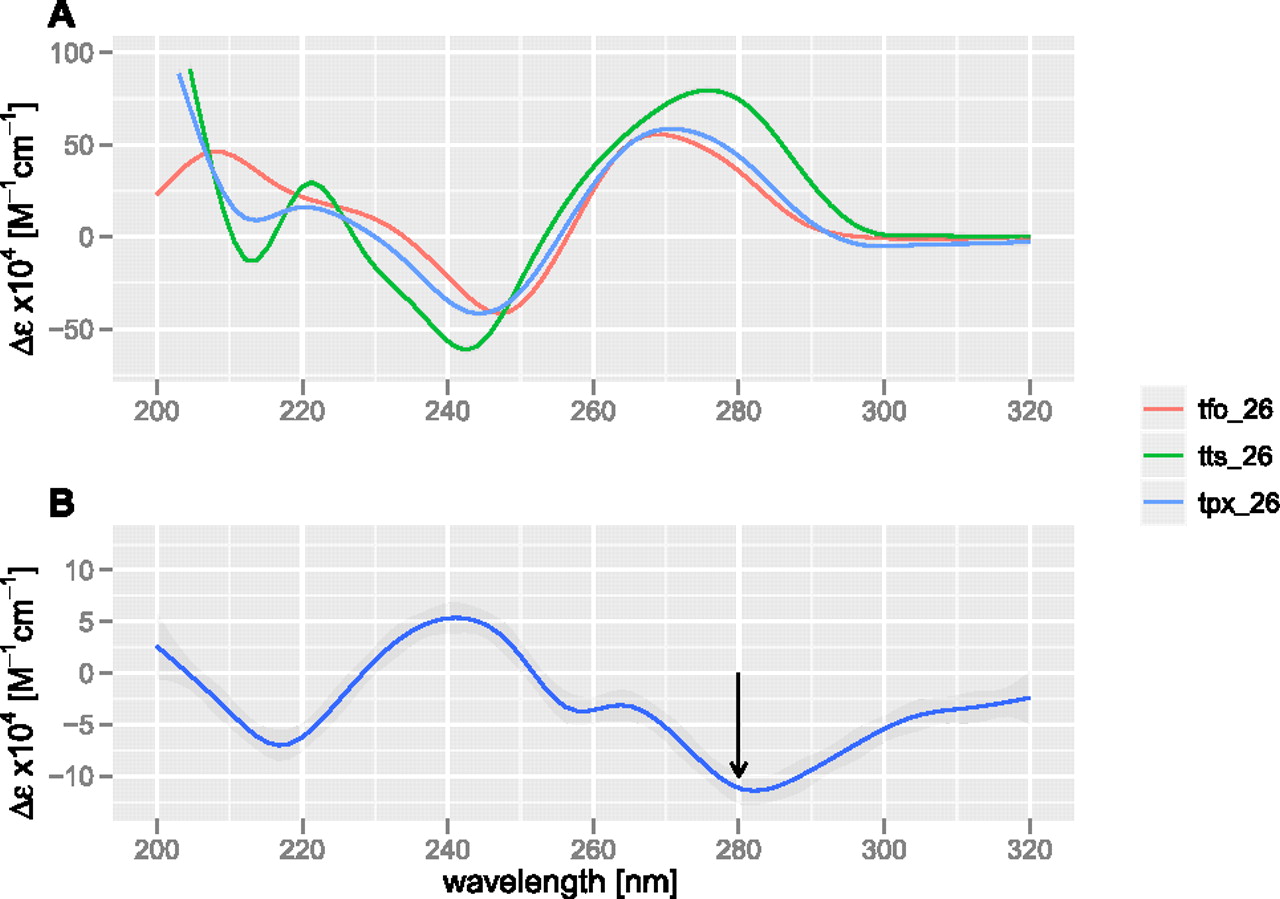
Figure 5.
CD spectra of oligo-nucleotide mixtures. (A) CD spectra of single-stranded oligonucleotide (tfo_26), duplex DNA (tts_26), and a mix of both (tpx_26) in phosphate buffer containing 137 mM Na+, 2.7 mM K+, 10 mM MgCl2 (pH 7), at 25°C. (B) Difference CD spectra for the triplex, where the average spectra of the individual components (tfo_26 and tts_26) are subtracted from the spectra of the triplex mix (tpx_26). Wavelengths of maximal difference peak around 280 nm.


