
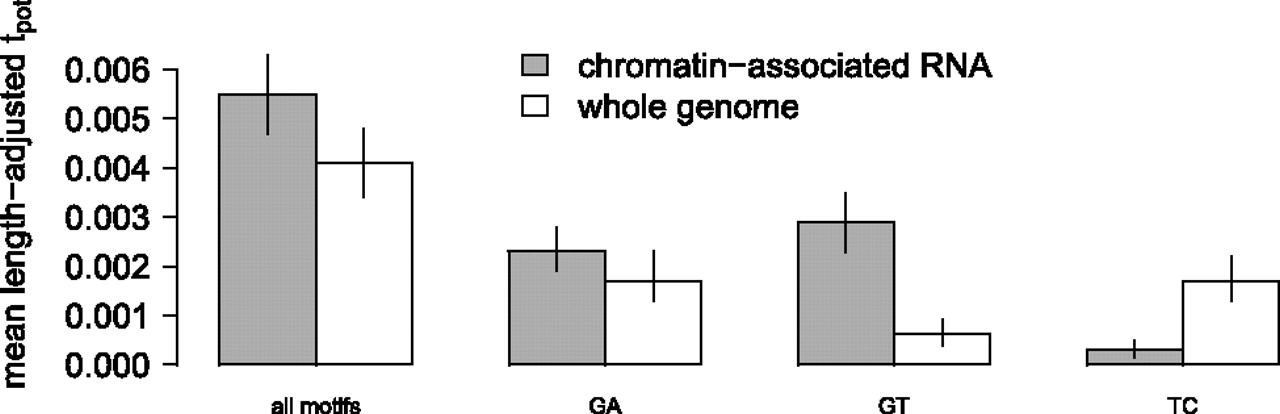
Figure 2.
Potential of small RNAs to participate in triplex formation. Each bar shows the mean length-adjusted triplex potential (Eq. 1) for chromatin-associated RNA (gray bars) or a set of synthetic RNAs sampled from the whole genome (white bars). The potential is shown over all motifs as well as for each motif individually (bars labeled “GA,” “GT,” and “TC”). Lines indicate the 90% confidence intervals based on bootstrapping.


