
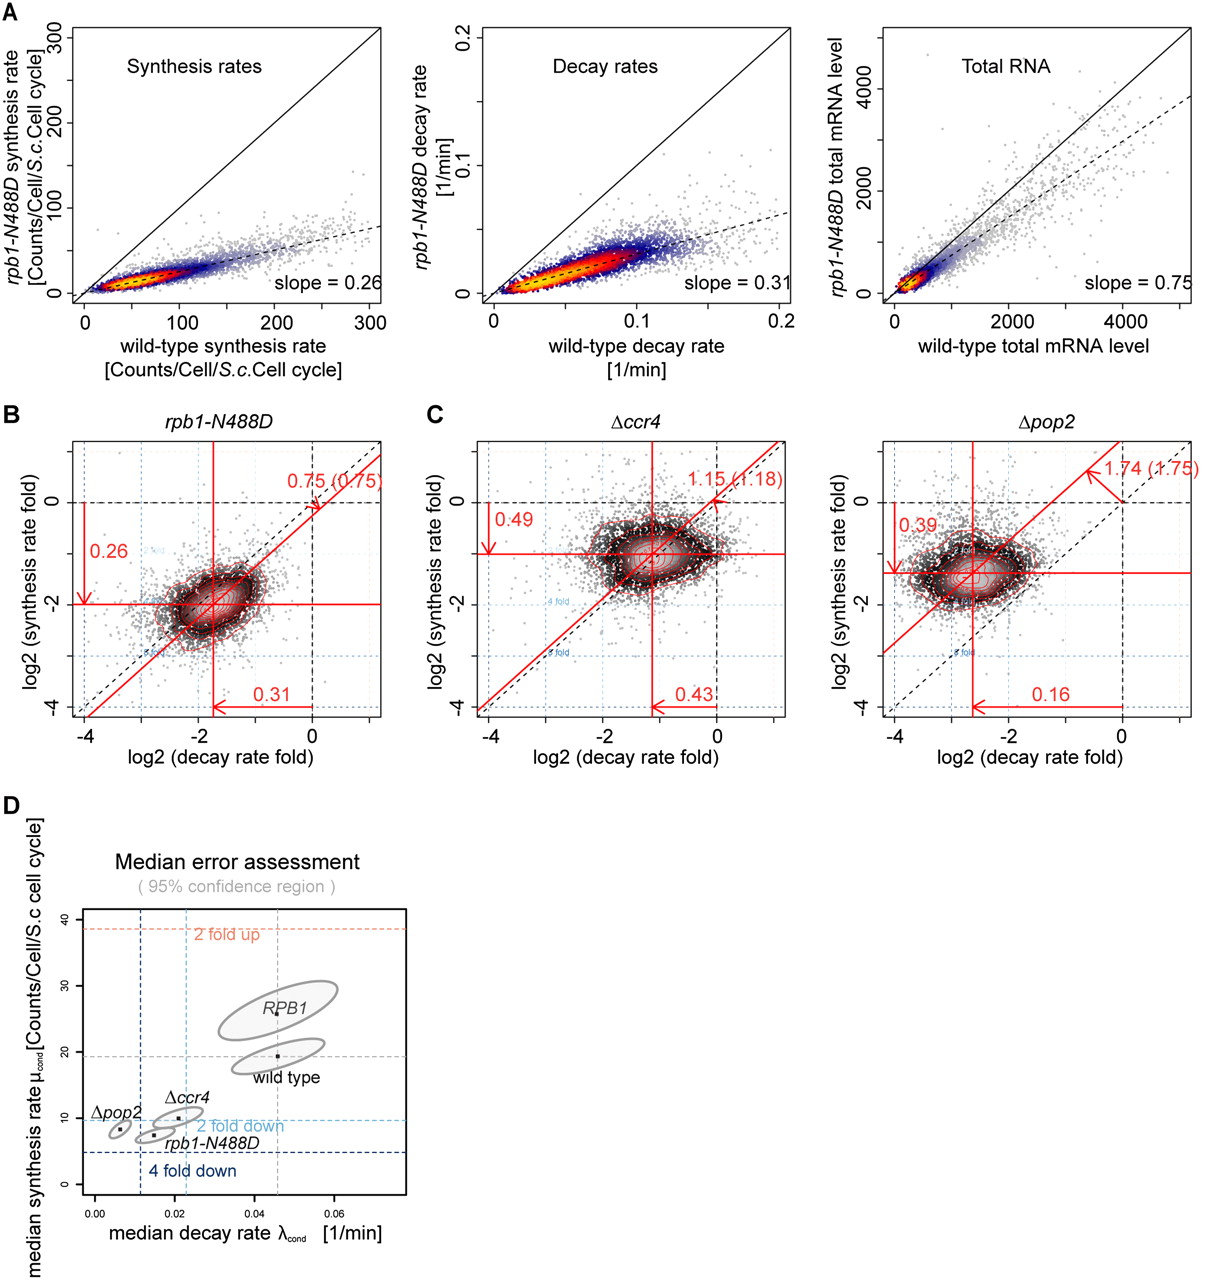
cDTA reveals changes in mRNA metabolism upon genetic perturbation. (A) Linear scatter plots (heat-colored) of mRNA synthesis rates, decay rates, and total mRNA levels in wild-type and mutant rpb1-N488D yeast strains as measured by cDTA. Slopes indicate global shift ratios of median synthesis rates, decay rates, and total mRNA of the rpb1-N488D mutant strain compared with wild type (0.26/0.31/0.75). (B) Alternative representation of the data from A in a single scatter plot comparing the changes in mRNA synthesis rates (log folds, x-axis) and decay rates (log folds, y-axis) in the rpb1-N488D mutant strain compared with the wild-type strain. Each point corresponds to one mRNA. The density of points is encoded by their brightness (grayscale). Contour lines define regions of equal density. The center of the distribution is located at (−1.8, −1.6), indicating that there is a global shift in the median synthesis rate by a factor of 0.26 (shift of the horizontal red line relative to the dashed x-axis line), and a global shift in the median decay rate by a factor of 0.31 (shift of the vertical red line relative to the dashed y-axis line). The global change in total mRNA levels is predicted by the offset of the diagonal red line from the dashed main diagonal, which corresponds to a change by a factor of 0.75. The number in brackets following this number (0.75) is the global change as it has been observed in the total mRNA measurements, which agrees well with the predicted number. The changes in total RNA levels do not exactly equal the quotient of synthesis and decay rate changes, due to an additional parameter for cell growth. (C) Scatter plots as in B comparing synthesis rates, decay rates, and total mRNA levels of Δccr4 and Δpop2 mutant strains to wild-type yeast. Ratios of median synthesis rates, decay rates, and total mRNA of the Δccr4/Δpop2 mutant strain compared with wild type are 0.49/0.39, 0.43/0.16, and 1.15/1.74, respectively. (D) Coupling of synthesis and decay rates, on the absolute level. For each condition, the median synthesis rate (y-axis) and degradation rate (x-axis) is shown (dark dots). (Dashed lines) Fold induction/repression relative to wild type. The dots lie approximately on a line with positive slope, indicating synthesis-decay compensation. A variation analysis for the estimation of the median synthesis and decay rates with cDTA has been performed. The ellipses show the 95% bootstrap confidence regions in each condition. The main axes of the ellipses reveal that the errors in the estimation of synthesis and decay rates are not independent, yet small enough to prove that the coupling is not due to estimation variance.


