
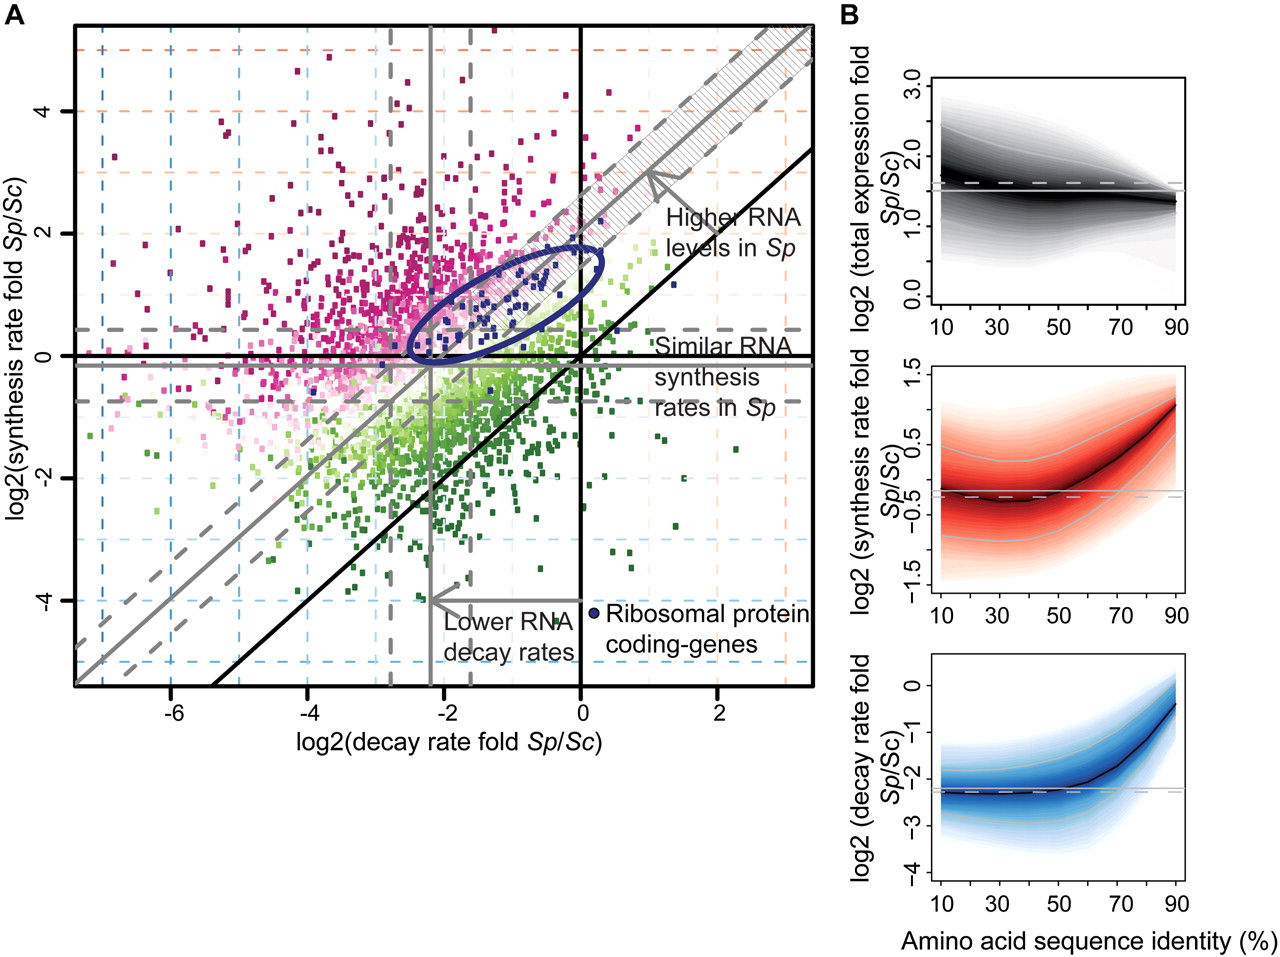
Comparison of mRNA metabolism in Sp and Sc. (A) Scatter plot comparing mRNA decay rate folds versus synthesis rate folds of Sp and Sc transcripts encoding protein orthologs (>25% amino acid sequence identity). The offset of gray lines to parallel black lines indicates Sp:Sc ratios of median decay rates, synthesis rates, or total mRNA (0.20/0.83/2.72). Dashed gray lines indicate 1.5-fold changes from the median (gray lines). Color scheme corresponds to folds in total mRNA (magenta, positive log fold; green, negative log fold). A set of genes that show higher decay and synthesis rates (1.5-fold and adjusted P-value 0.5%), but almost unchanged (<1.5-fold) total mRNA (93 transcripts, striped area) was selected and tested with a Bayesian network-based gene-set analysis (MGSA) (Bauer et al. 2010). In this gene set, the ribosomal protein genes were enriched (blue dots; ellipse shows the 75% region of highest density). (B) Plots show log2 fold distributions of total mRNA (gray), synthesis rate (red), and decay rate (blue) of Sp versus Sc transcripts encoding orthologous proteins as a function of amino acid sequence identity (%). Transcripts encoding highly conserved proteins such as ribosomal proteins are located on the right. They show more rapid turnover (synthesis and decay) in Sp, resulting in similar mRNA levels. (Solid black lines) Median log2 fold; (shaded bands) central 80% regions. (Solid/dashed gray lines) Median log2 fold of all orthologs/all genes.


