
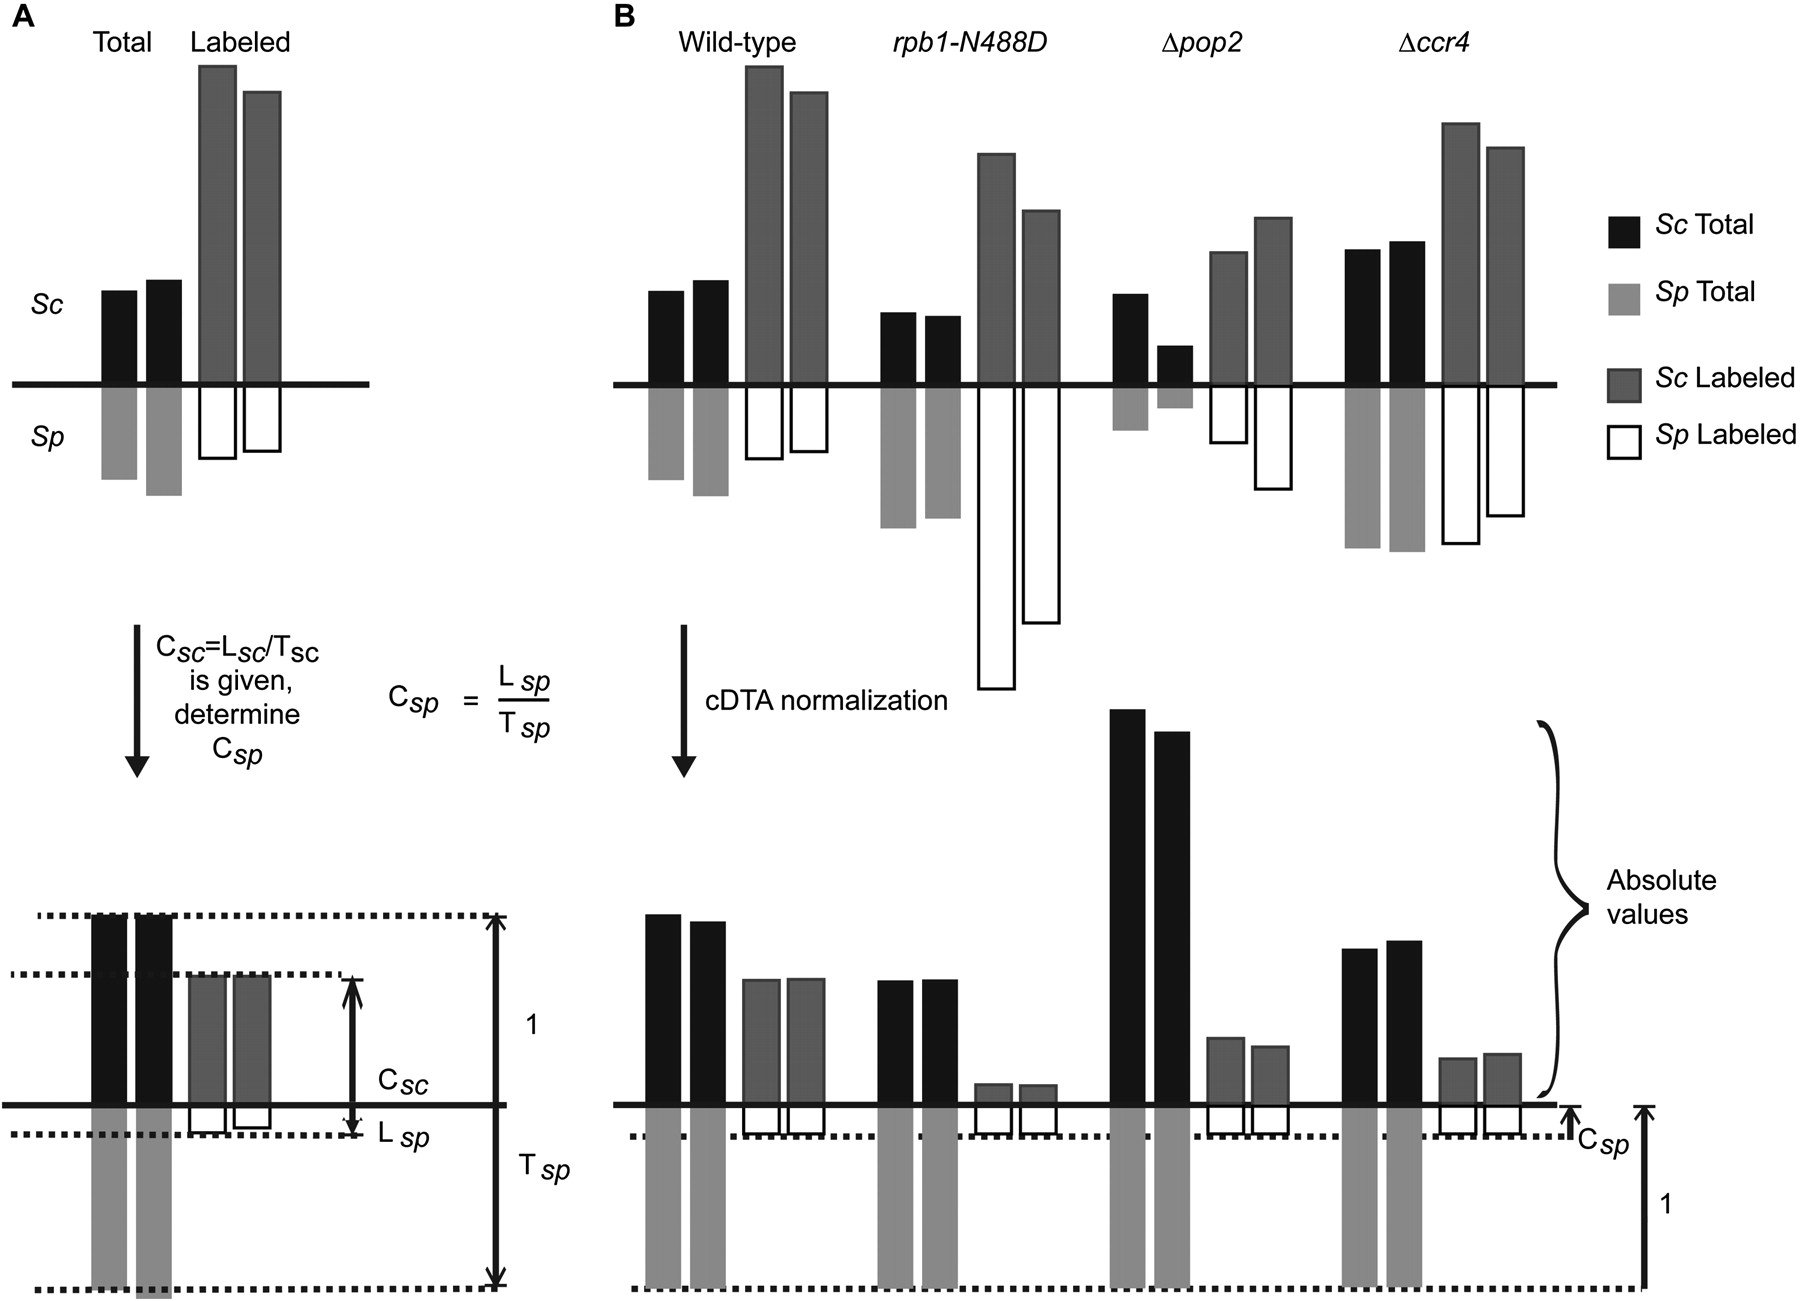
cDTA normalization reveals global changes. (A) Determination of cSp, the ratio of labeled over total Sp mRNA. To obtain absolute synthesis and decay rates for Sc and Sp, we derived ratios of labeled to total RNA cSc and cSp for Sc and Sp, respectively. The cSc ratio was obtained in our previous study (Miller et al. 2011). To determine cSp, Lsc and Tsc are set to cSc and 1, respectively. Lsp and Tsp are then linearly rescaled. The resulting Lsp/Tsp is defined as cSp and then used in the further experiments as the global cDTA normalization factor. (B) cDTA normalization uses Sp signals as an internal standard. The bars indicate the median intensities of the array probe sets. Due to our experimental design, the ratio of labeled to total Sp RNA (cSp = Lsp/Tsp) must be the same in all experiments. To correct for differences in cell lysis, RNA extraction efficiency, and RNA purification efficiencies, the levels of Sp total and labeled mRNA are rescaled to the same values in all experiments. The Sc RNA levels are then corrected by median centering of Sp RNA levels. This normalization allows for a direct comparison of Sc data between experiments. Shown are both replicates for each of the four cDTA experiments.


