
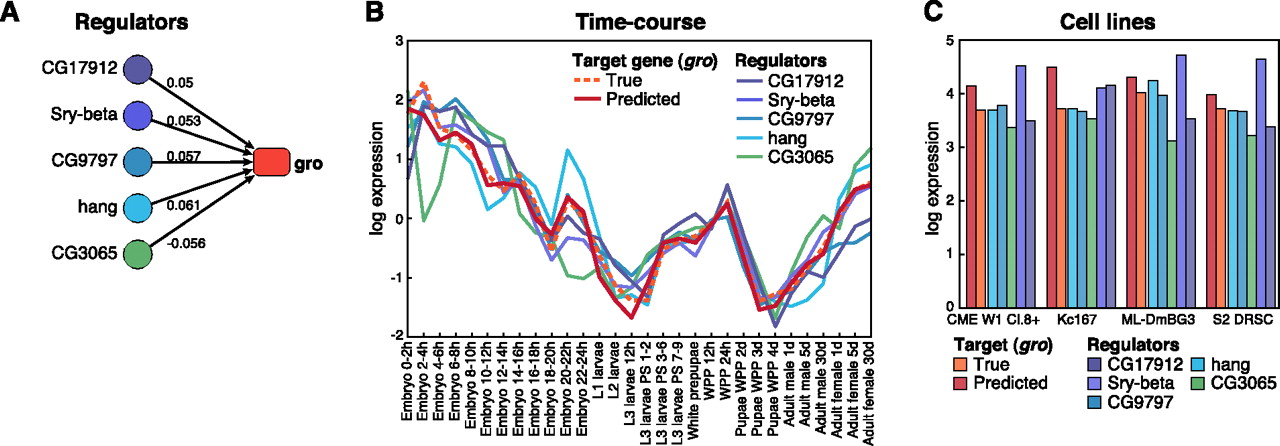
Expression prediction of the gro target gene. (A) The top five regulators of the gro gene and the magnitude of the regression coefficients. Regulators are colored based on the sign and magnitude of the regression coefficient (green indicates repressors; red, activators; darker, stronger). (B) True expression (dashed orange line) and predicted expression (solid red line) for the gro gene across the developmental time-course. The remaining lines show the corresponding expression profiles of the five regulators, colored according to panel A. (C) True and predicted expression levels of the gro gene in four cell lines, using the same coefficients from panel A as learned on the expression time-course. The expression levels of the five regulators are also shown.


