
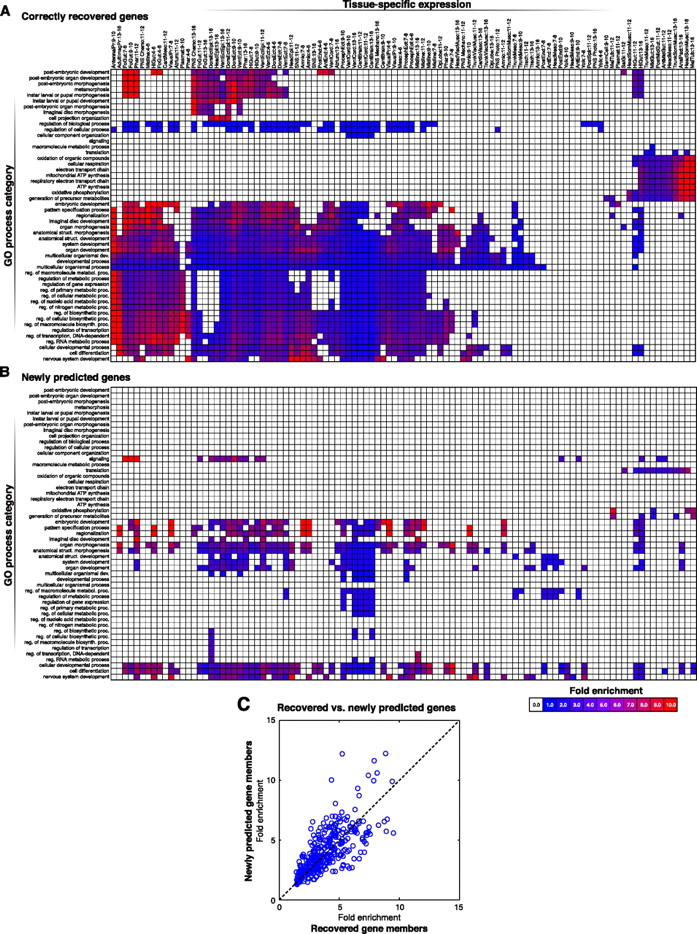
Tissue-specific expression of correctly recovered (known) versus newly predicted genes of different GO process categories. (A) The heatmaps show, for the set of predicted gene members of each GO category (rows), the enrichment for expression in specific tissues (columns). Only those GO processes that are significantly enriched in at least one tissue (hypergeometric test with FDR < 0.05; Methods) are shown. For most GO categories, the correctly recovered (known) genes are enriched in specific tissues. (B) The newly predicted genes for a given GO category tend to be enriched in fewer, but similar, tissues as the known gene members. (C) The scatter plot compares the fold-enrichment (see Methods), for the ImaGO tissues that were enriched in both the recovered and newly predicted gene members of a given GO category. For these same tissues that the known genes are enriched for, the newly predicted genes have similar or higher enrichment.


