
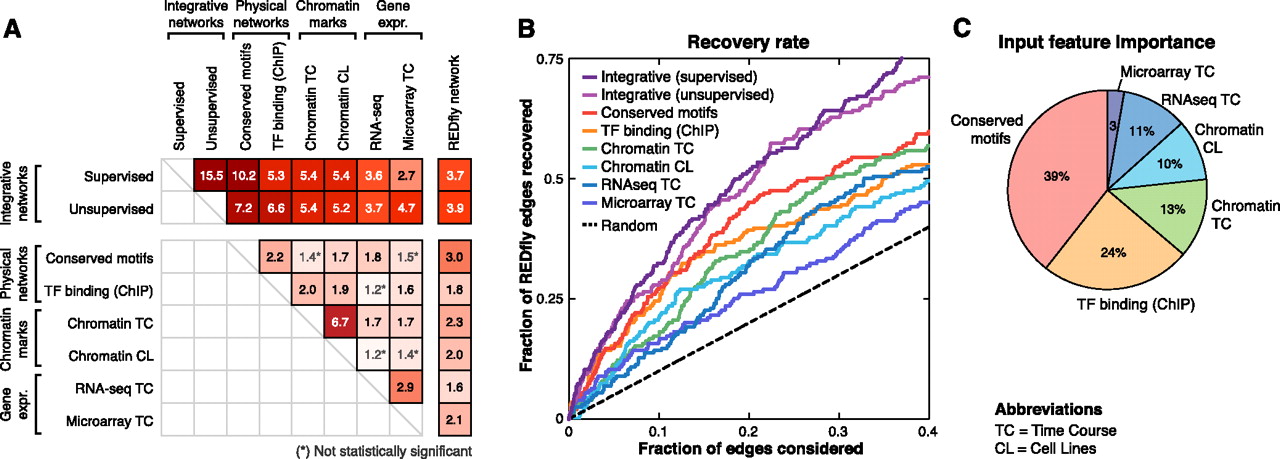
Comparison of known, predicted, and single-feature networks. (A) Pairwise network comparison based on the enrichment for common interactions among feature-specific networks (physical, chromatin, gene expression), the integrative networks (supervised and unsupervised), and the REDfly network. (Black) Enrichment values that are statistically significant (P < 0.05, hypergeometric); (gray) enrichment values not statistically significant. Enrichment of each feature-specific network with REDfly tends to be stronger than its enrichment to other feature-specific networks of different types (between physical, chromatin, expression), suggesting that these features are capturing complementary sets of interactions. Integrative networks show the strongest enrichment for known edges. (B) Recovery of known REDfly edges at different thresholds for both integrative and feature-specific networks. (Curves) The fraction of the 204 REDfly edges recovered versus the fraction of predicted interactions considered (the expected number of edges recovered by chance [random; dashed line] is kP/T, where k is the number of edges considered, P is the number of REDfly edges, and T is the total number of possible edges). Integrative networks reach significantly higher recovery rates than single-feature networks, highlighting the importance of data integration. (C) Relative importance of the different input features in the supervised integrative network evaluated as the percentage contribution to the increase in scores of the top 10,000 edges (see Methods). Evolutionarily conserved motifs are the strongest contributor, followed by TF binding data (ChIP), chromatin marks, and expression data.


