
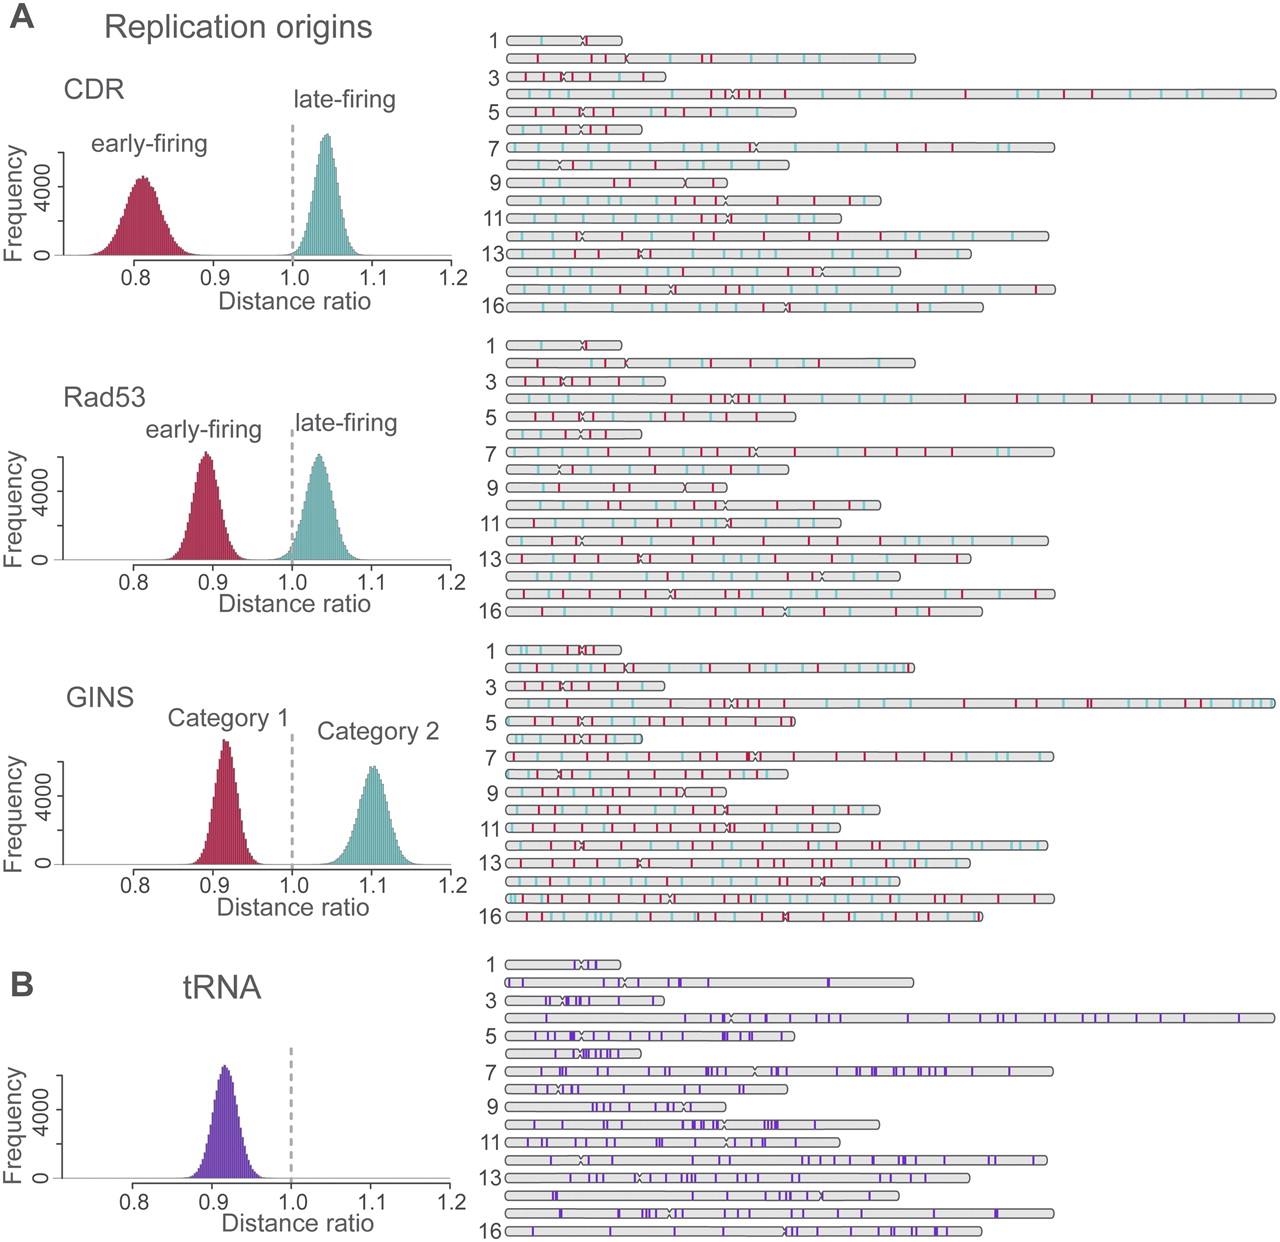
Spatial clustering of replication origins and tRNA gene loci. (Left) The histograms show the distribution of the mean pair distance ratio between a set of specific sites (e.g., early replication sites) and all sites in the structures of the population. The histograms are generated as follows: For a given structure in the population, the mean pair distance between a set of specific loci (e.g., all early replication origins) is calculated. This distance is divided by the mean pair distance of all sites in the same structure. The distribution of the distance ratio is then obtained from all structures in the population. If the distribution is centered on 1 (vertical dashed line), the selected sites behave similarly to a random sample of all sites. If the distribution is shifted toward smaller values, their pair distances are smaller than would be expected from the background control. If the distribution is shifted to larger values, the selected sites are more distant from each other than would be expected from the random control background. (A) Distribution of distance ratios of early (red) and late (green) replication start sites as determined by three independent experiments using the CDR (Clb5 Dependent Region), Rad53 checkpoint-mediated regulation, and GINS complex as identifiers. For the latter case, category 1 sites start replication earlier than category 2 sites. (Right panel) The positions of each site in the chromosome sequence. The number of early- and late-firing sites labeled with CDR, Rad3, and GINS are 77 and 123, 101 and 99, and 169 and 135, respectively. (B) Distribution of distance ratios for all 275 tRNAs (loci extracted from SGD, http://www.yeastgenome.org). For all sets of sites in A and B, the shift of the mean pair distances is highly statistical significant (for details, see Supplemental Material and main text).


