
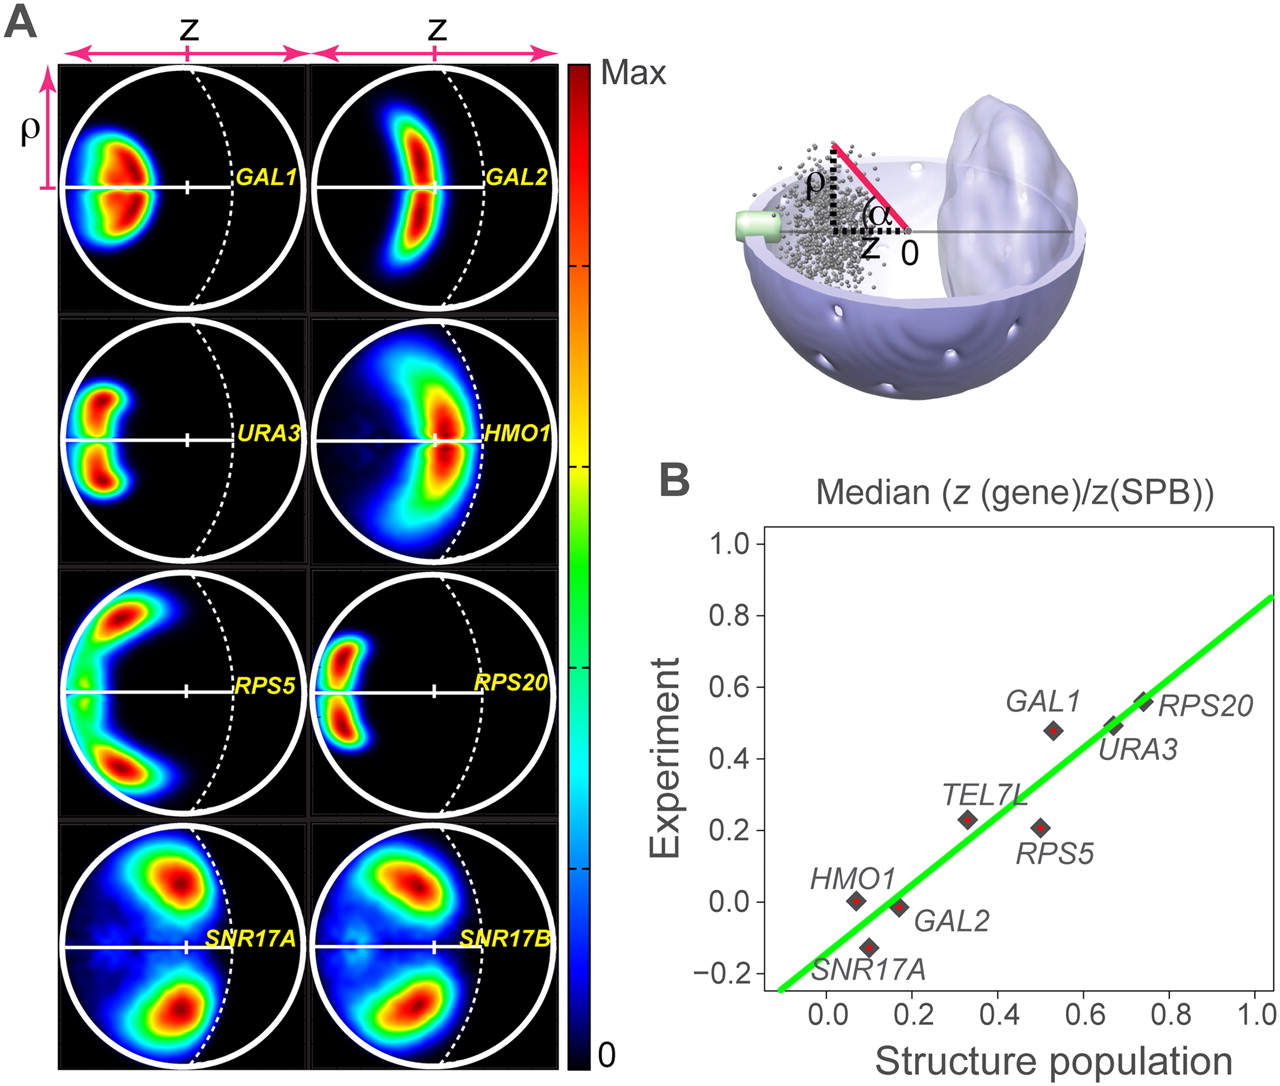
Gene territories. (A) Projected localization probability densities for the positions of eight gene loci in the structure population. The probability densities are determined with respect to two principal axes of the nuclear architecture (top right panel). The z-axis connects the SPB with the origin at the nuclear center and the nucleolus. The radial axis ρ defines the distance of a point from the central axis (top right panel). The lower half of the projected localization density plot is mirrored from the top half for visual convenience. (B) Median gene loci position along the z-axis calculated from the projected probability localization densities in A and from the experiment (Berger et al. 2008). The two are highly correlated with R2 = 0.9. To allow for comparison with the experiment, the z-axis distance of a gene locus is normalized relative to the SPB–gene distance.


