
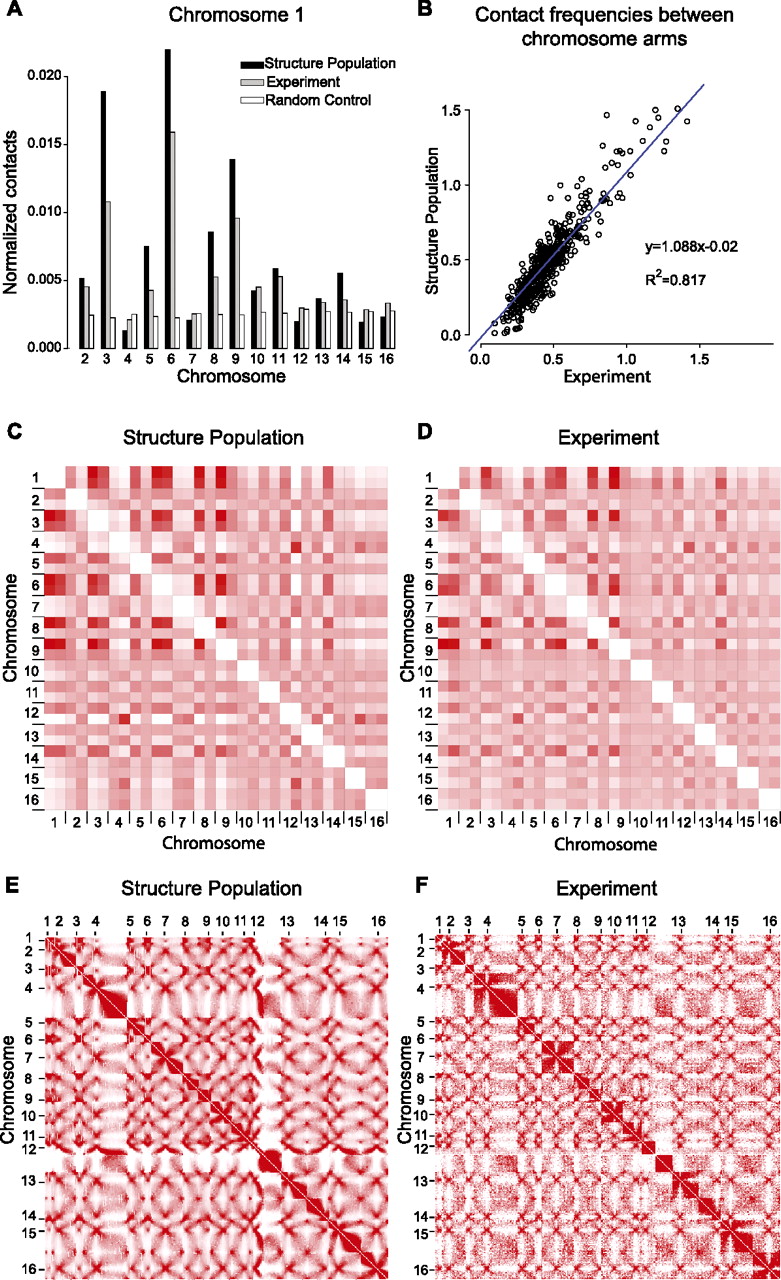
Chromosome and gene loci interactions. (A) Histogram of the normalized contact frequencies of chromosome 1 with other chromosomes in the structure population (black bars), chromatin conformation capture experiments (gray bars) (Duan et al. 2010), and the random control population (white bars). Contact frequencies of other chromosomes are shown in Supplemental Fig. 2. (B) Comparison of chromosome-arm–chromosome-arm contact frequencies from the structure population and experiments (Duan et al. 2010). (C,D) Contact frequency heat maps for chromosome arm contacts in the structure population (C) and experiments (D) (Duan et al. 2010). Heat maps of the genome-wide contact frequencies between loci at 32-kb resolution determined from the structure population (E) and in a chromosome conformation capture experiment (F) (Duan et al. 2010). (Color code ranges from white for low to red for high values.) Centromere positions are marked by the ticks. The row-based average Pearson's correlation between the two heat maps is 0.94 (all P-values <10−6). The largest differences between both heat maps involve interactions to the small arm of chromosome 12, which is not surprising because it contains all of the rDNA genes located in the nucleolus, which are not explicitly treated in our simulation. To further improve these interactions it is necessary to include these regions in future simulations (see Supplemental Material).


