
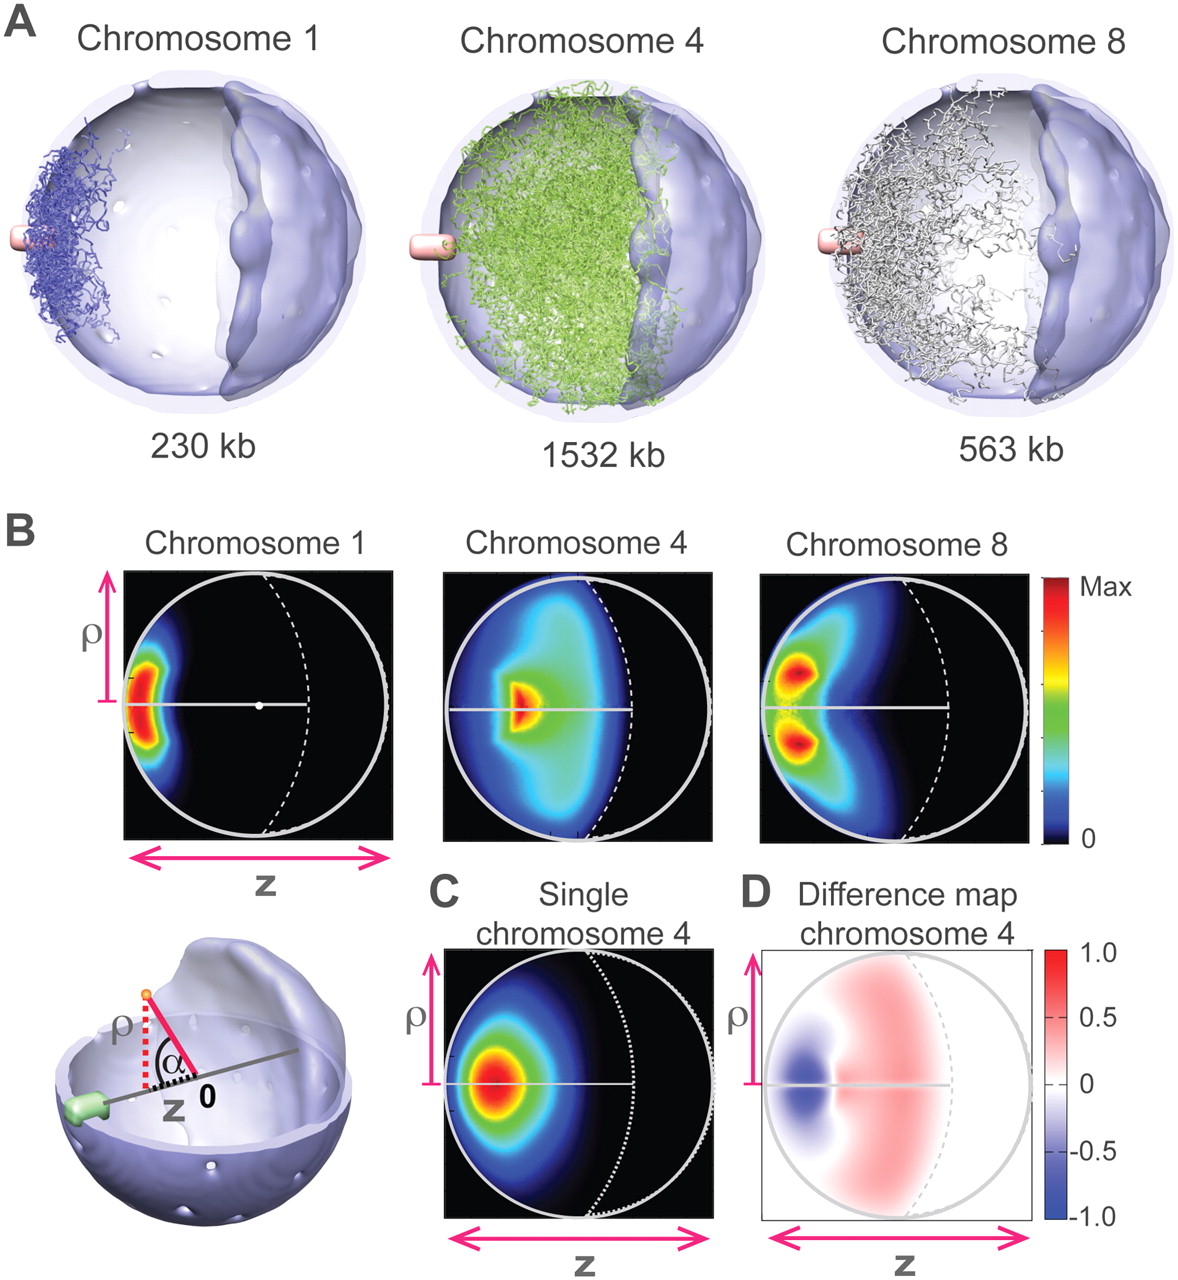
Chromosome locations. (A) A sample of 40 chromosome configurations randomly selected from the structure population for the small chromosome 1 (left panel, blue chains), the large chromosome 4 (middle panel, green chains), and the medium-sized chromosome 8 (right panel, gray chains). The chain thickness is reduced to enhance visibility. The chromosomes are depicted in the nucleus with the SPB in pink, the nucleolus in dark blue, and the NE in light blue. (B, top) Chromosome localization probability densities (LPDs) of chromosomes 1 (left), 4 (middle), and 8 (right panel) plotted along the two principal axes ρ and z (Supplemental Material). (Lower left) Reference frame for projecting the positions of chromosome points onto the two principal axes, namely, the projection along the central axis z (connecting SPB, nuclear center, and nucleolus), and the radial distance ρ-axis indicating the absolute distance of a point from the central axis. (C) The LPD of chromosome 4 resulting from the “single chromosome population.” The chromosome is subject to all landmark constraints, but structures are generated without the presence of other chromosomes in the nucleus. The density distribution is significantly different from the situation when all chromosomes are present (see B). (D) Excluded volume effect. The difference map between the LPDs of chromosome 4 from the structure population when all chromosomes are present (B, middle) and the single chromosome population as defined in C.


