
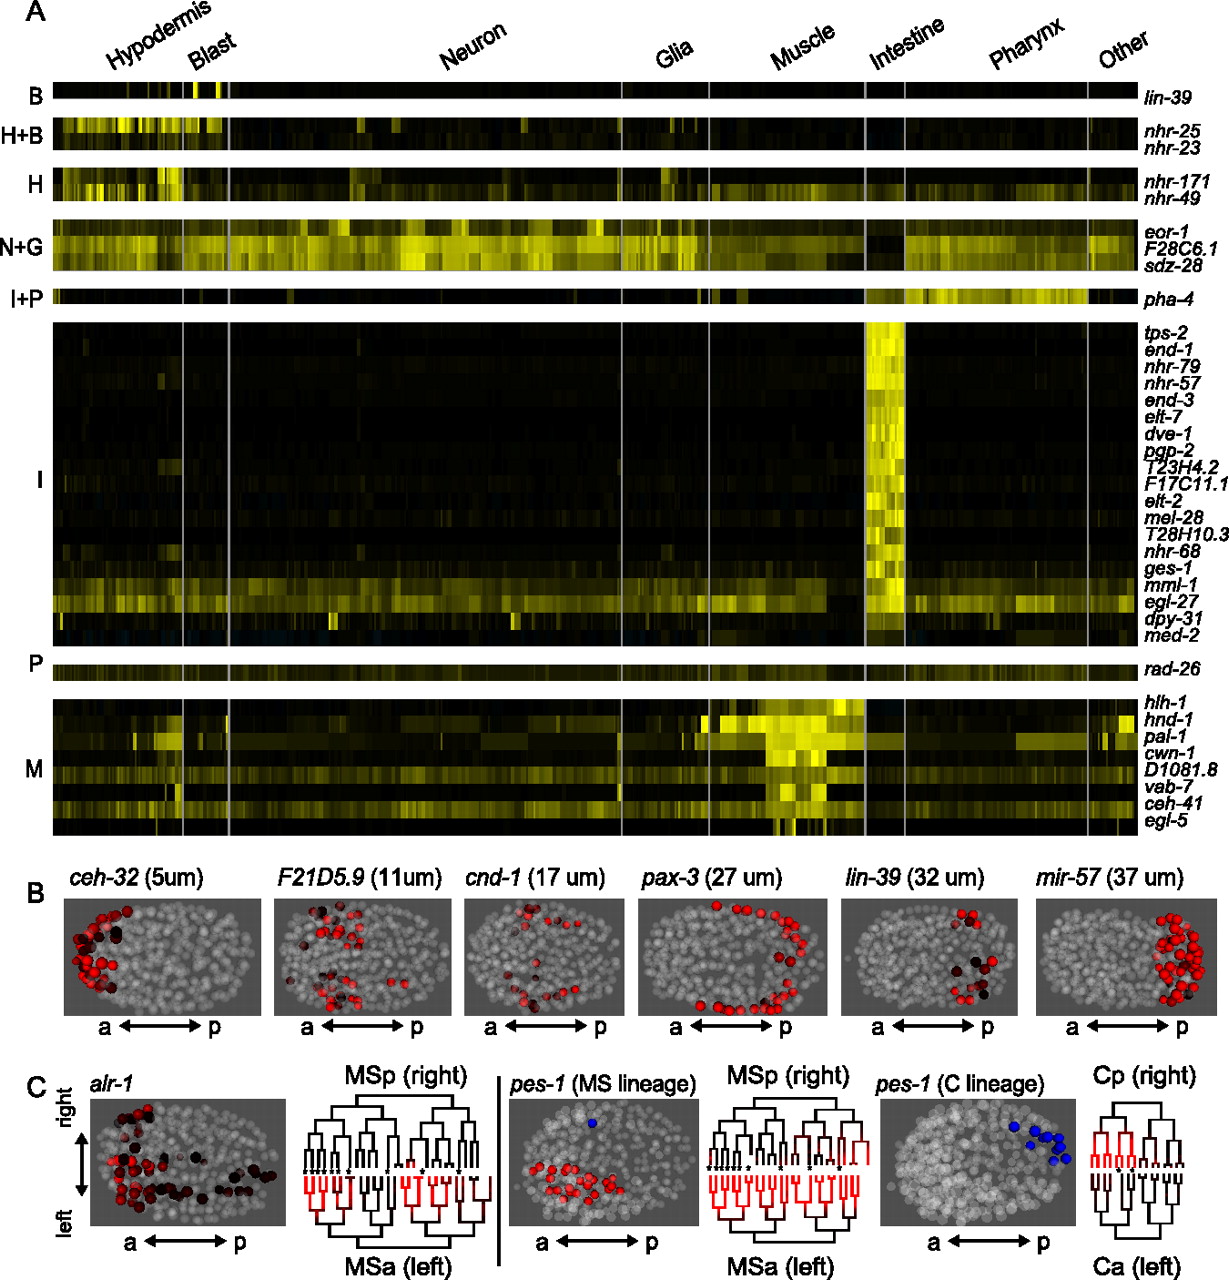
Multidimensional regulation of expression. (A) Tissue-correlated expression. Cells are arranged by tissue on the x-axis and genes are sorted by which tissue or combination of tissues they are best correlated with: (B) Blast; (H) Hypodermis; (N) Neuron; (G) Glia; (I) Intestine; (P) Pharynx; (M) Muscle. Genes were included if their correlation coefficient to a given tissue identity was greater than 0.4. (B) Position-correlated expression. Three dimensional models showing the location and measured intensity of all expressing cells for six reporters expressed in specific anterior–posterior positions at the 350-cell stage. (C) Left–right asymmetric expression (expression in an individual cell pair considered asymmetric if at least 10-fold different, see Methods for details). For the alr-1 reporter, all expressing cells are shown in the projection colored by intensity, and the lineage shows left-biased expression in the MSa and MSp lineages. MSa (left) and MSp (right) produce symmetrically equivalent cells except for the branches marked with an asterisk (*). pes-1 reporter expression in MS is biased for the left (MSa colored red) cells and only expressed in one right (MSp colored blue) cell, while in the C lineage the expression is limited to right cells (Cp, colored blue). Notably, pes-1 expression in other lineages is L–R symmetric.


