
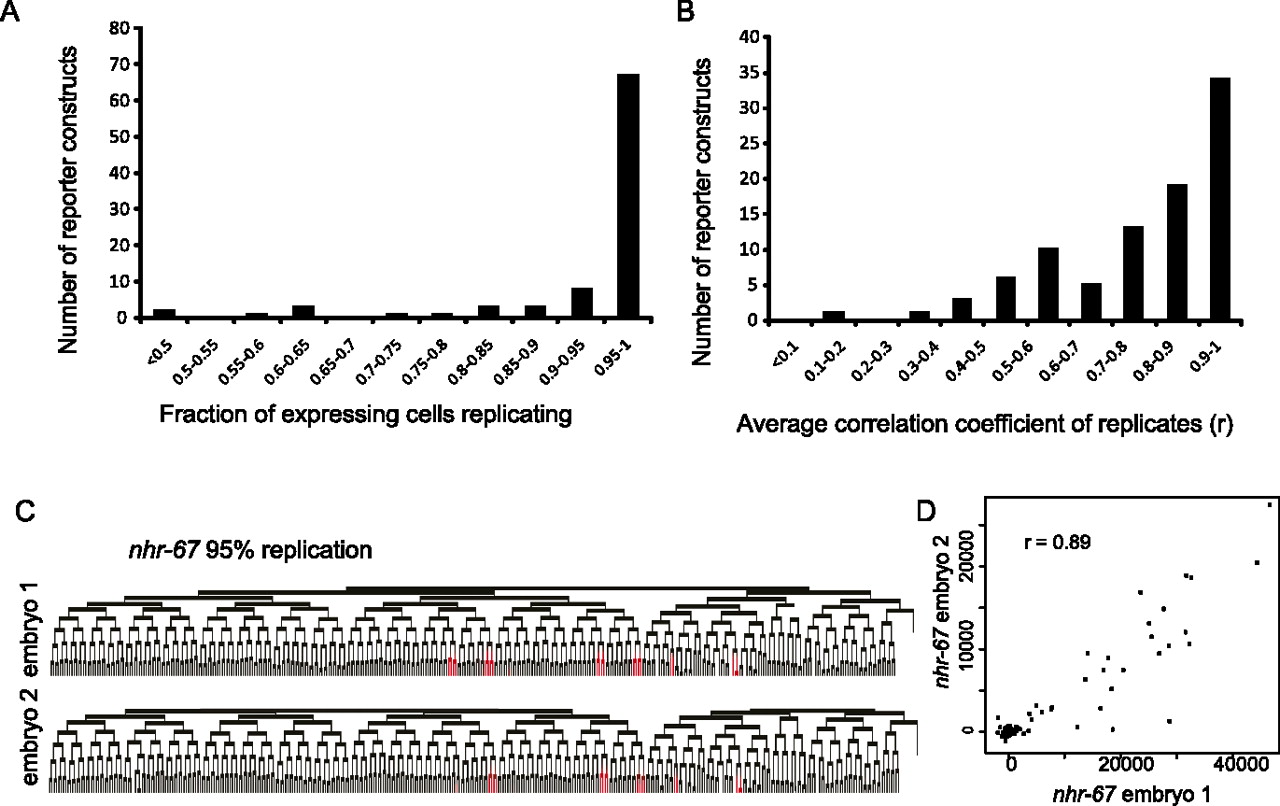
Consistency of observed expression in replicates. (A) Replication frequency for each reporter construct. For each pair of replicate embryos, we calculated the fraction of cells expressing with a peak intensity >5000 in the first embryo that also expressed with a peak intensity >2000 in the second embryo, and display the results after averaging for each gene (n = 52 genes). (B) Quantitative consistency. We compared the average fluorescence intensities of all cells for each by calculating the correlation coefficient (r), and averaged the correlation coefficients obtained for all replicates of a given gene. (C) An example pair of replicates for nhr-67, a case where the replication frequency is 95% and (D) the correlation coefficient is 0.89. This approximately represents the lower quartile of replication (75% of genes were more consistent in their expression than this pair).


