
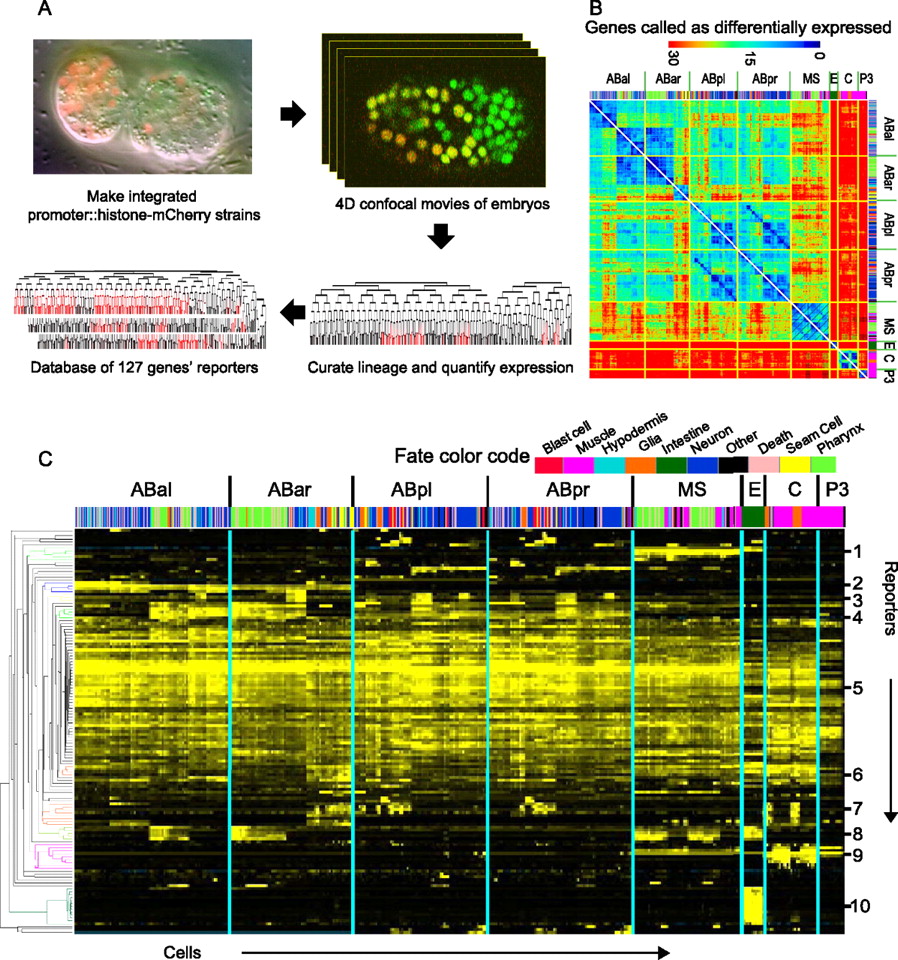
Reporters show expression in a wide range of patterns and onset times. (A) Data collection strategy. Confocal movies are collected and analyzed by cell tracking (StarryNite) to generate a cell lineage tree. Expression is visualized by converting the raw reporter intensity in each cell into a color on a black→red scale (from minimum to maximum expression) and displaying the color on the appropriate branch of the tree. (B) Heat map showing how many genes were expressed differently (10-fold criteria, see Methods) between each pair of leaf cells (arranged in lineage order with color-coded fate bar). The cells with the most closely related expression patterns are generally close lineal relatives (dark blue on diagonal axis). For example, a muscle cell (pink in fate color code) from the MS lineage is more similar in expression to all other MS-derived cells (including pharyngeal and nervous system cells; large diagonal lines) than it is to muscle cells from the C or P3 lineages (small diagonal lines). Tissue color code is shown below. Secondary diagonals of similar cells (e.g., between ABpl and ABpr) represent l-r symmetric lineages; these symmetries were also observed by Liu et al. (2009) in 363 larval cells. (C) Expression patterns organized by hierarchical clustering (y-axis). The cells (x-axis) are arranged in lineage order. The numbered clusters (right), which correspond to the colored sections of the tree on the left, include multiple constructs with patterns biased toward (1) EMS lineage, (2) ABa lineage, (3) AB sublineages, (4) AB notch-signaled lineages (Priess 2005), (5) broad or ubiquitous patterns, (6) broad expression with hypodermal bias, (7) hypodermal precursors, (8) pharyngeal and intestinal precursors, (9) muscle precursors, (10) intestinal precursors. A full-resolution version of the cluster view is available as Supplemental Figure 3.


