
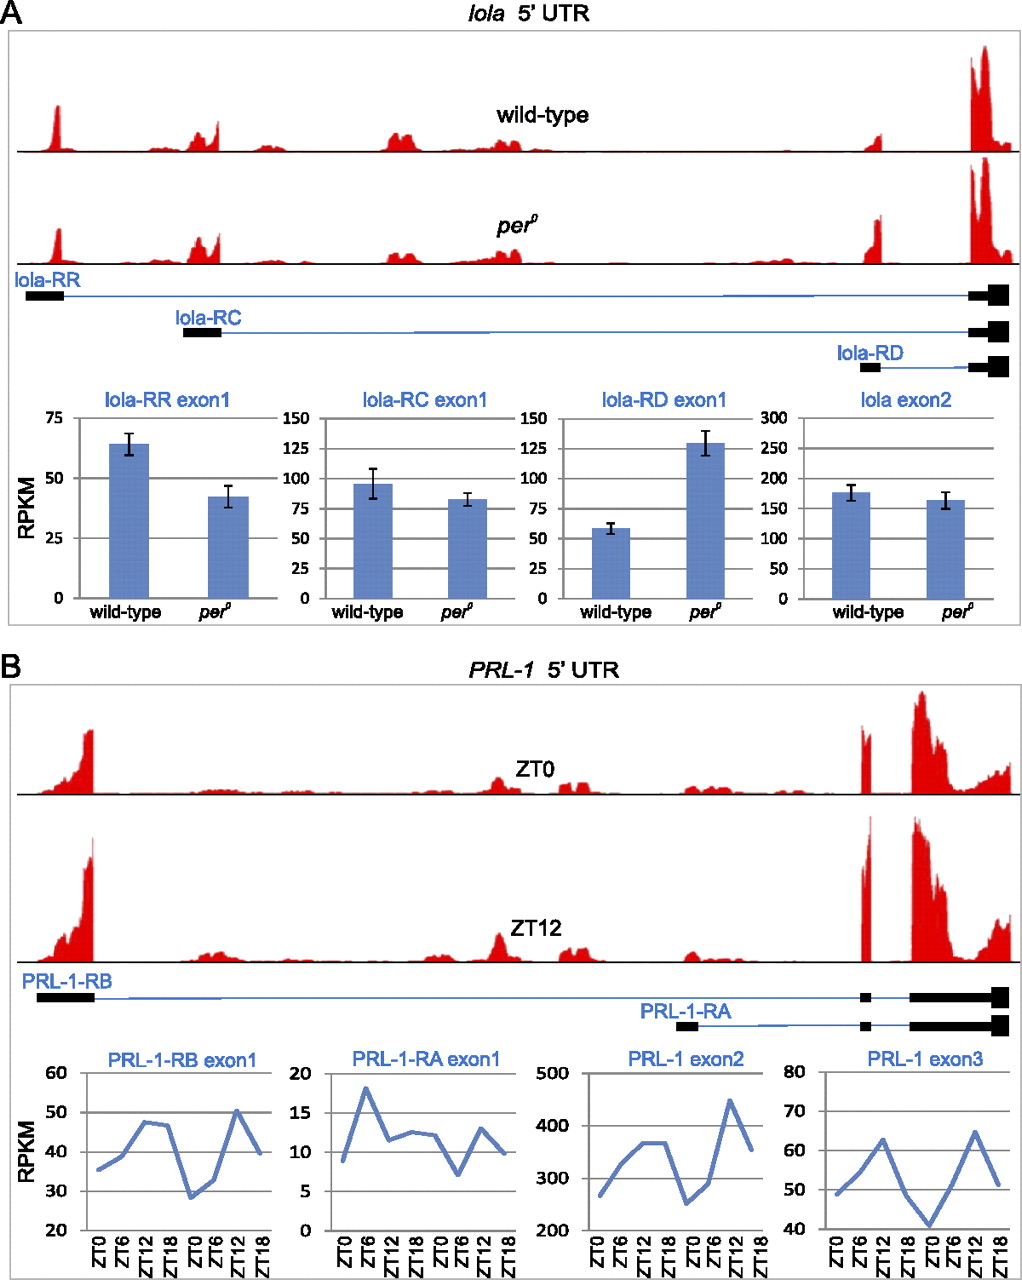
Figure 8.
Examples of alternative splice isoforms regulated by per loss-of-function and time-of-day. The 5′ UTR and nearby coding exons are shown for lola (A) and PRL-1 (B). (Solid black bars) Exons; (blue lines) introns. (Red histograms, top) The depth of sequencing coverage for wild-type and per0 samples (lola) or ZT0 and ZT12 (PRL-1). Bar graphs or line graphs show the expression levels of individual exons (bottom).


