
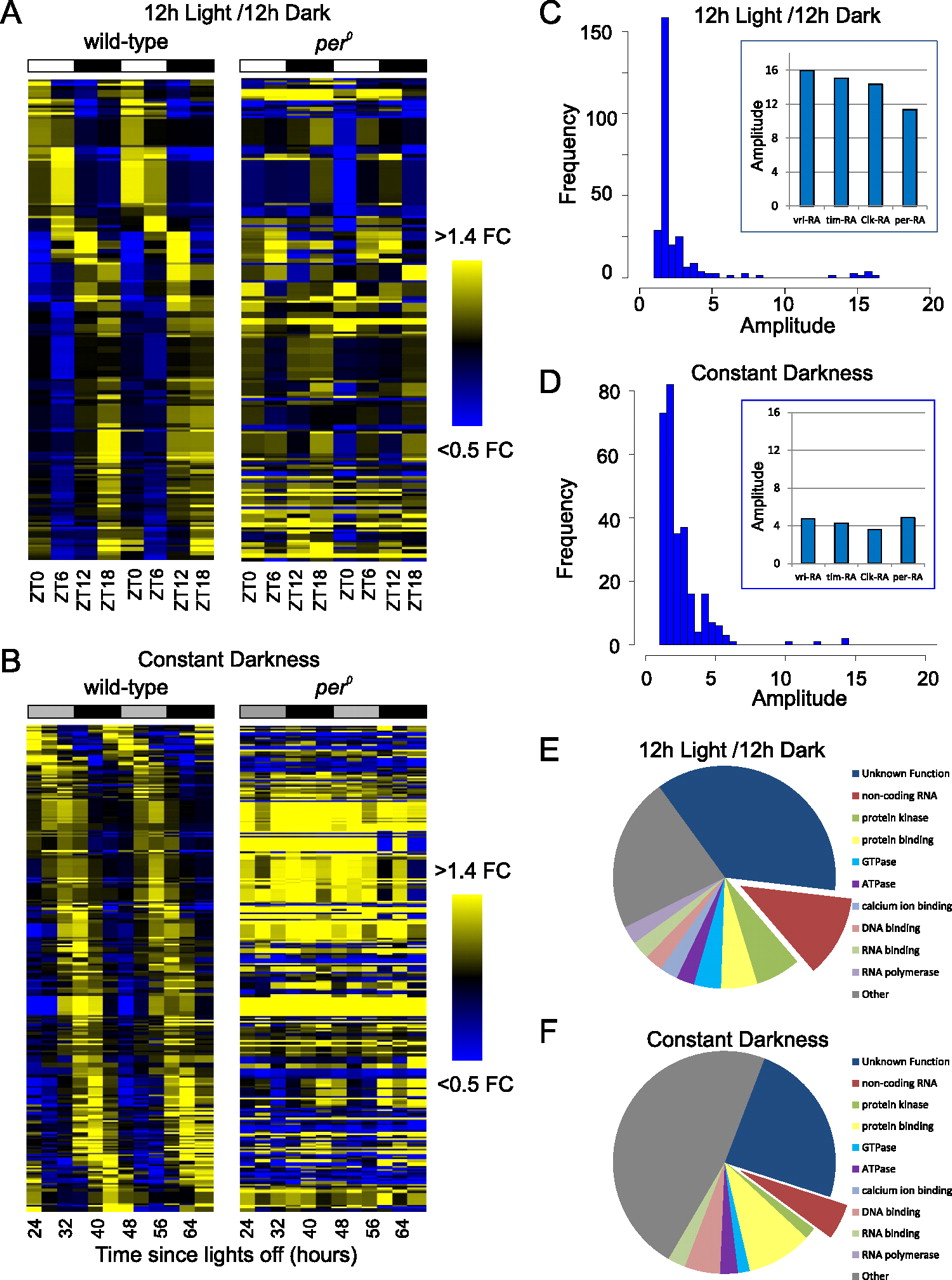
Twenty-four-hour transcriptional rhythms. The fold-changes (FC) of median-normalized cycling transcripts (p < 0.05, Fisher's G-test) are plotted as a heatmap for LD (A) and DD (B) samples. Transcripts are ordered by phase, as measured by JTK_Cycle. The order of transcripts along the vertical axis is identical between wild-type and per0. Distribution of amplitudes (maximum expression divided by minimum expression) of cycling transcripts for LD (C) and DD (D) samples; (inset) individual amplitudes of transcripts encoding key circadian clock components. Molecular functions as annotated in FlyBase of cycling genes are displayed as a pie chart for LD (E) and DD (F) (p < 0.05 for both JTK_Cycle and Fisher's G-test).


