
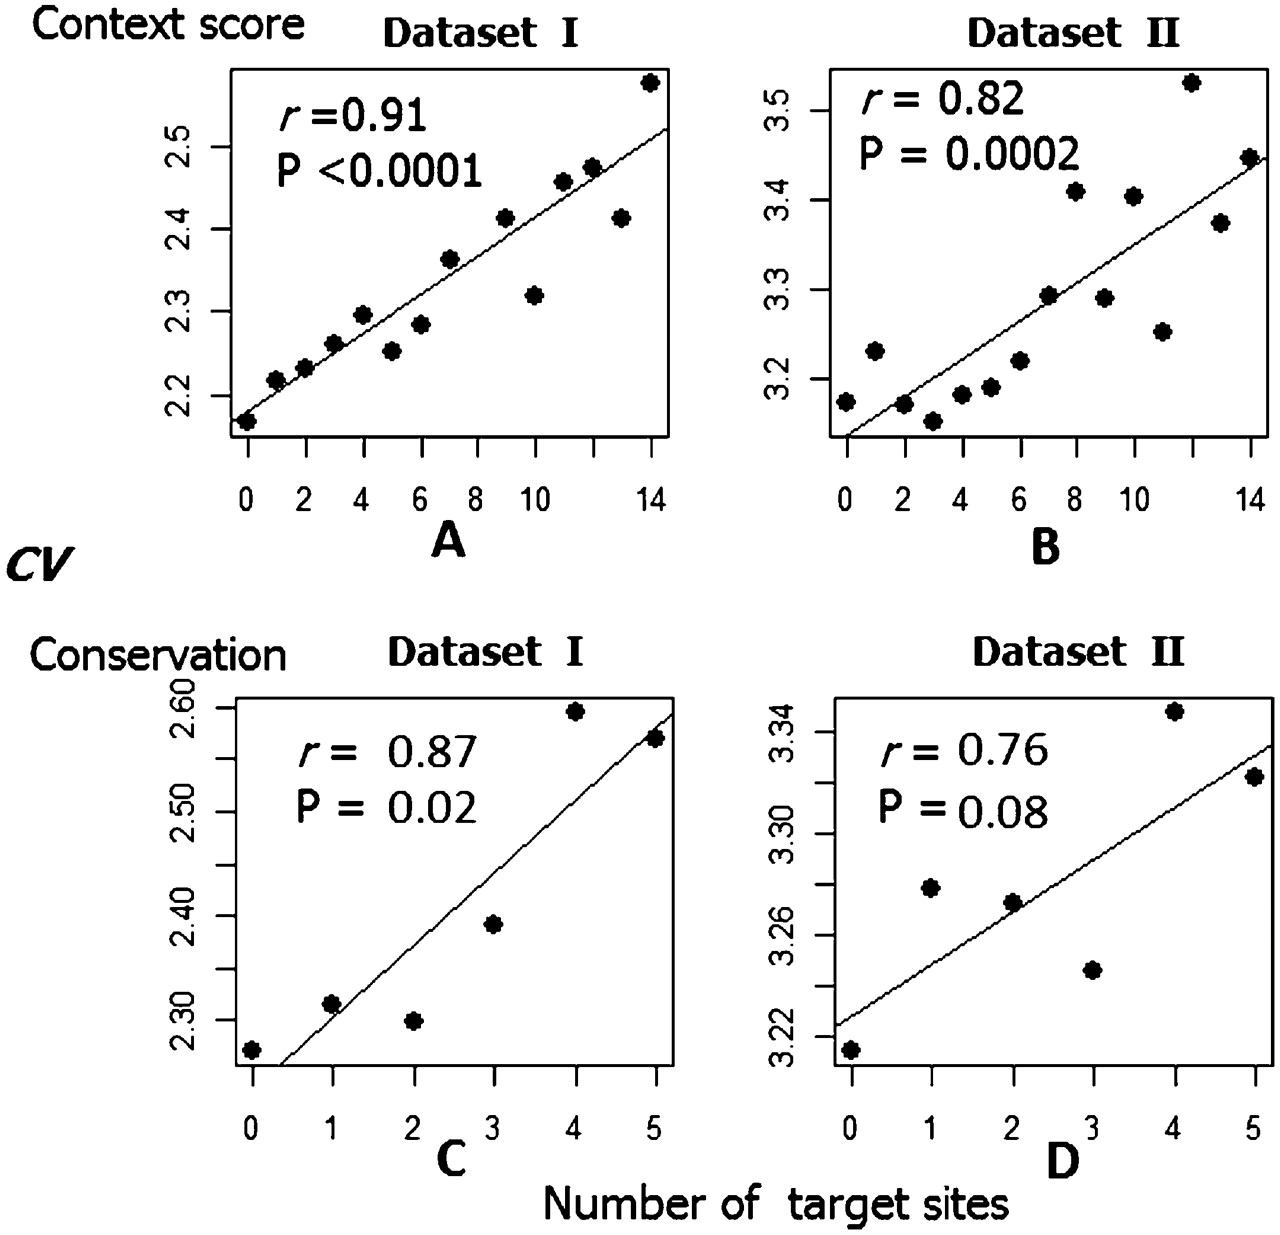
The magnitude of the miRNA regulation effect is positively associated with gene expression variability. In each plot, the x-axis is the number of target sites. (A,B) The number of the putative miRNA target sites predicted by TSt (context score ≤ 0.3) and the median CV for the transcripts in data sets I and II. The number of distinct miRNA target sites that are harbored in an mRNA 3′ UTR varies from 0 to 14 (a small number of mRNAs have >14 sites and are binned into 14). (C,D) The number of conserved miRNA-interacting sites (based on TSs PCT > 0.8) and the median CV of the genes. The number of conserved target sites located in one transcript is generally smaller than the number of sites predicted by context score, and varies from 0 to 5 (a small number of mRNAs have more than five sites and are binned into five). Only microarray probes that are mapped on the RefSeq genes are used in the two data sets.


