
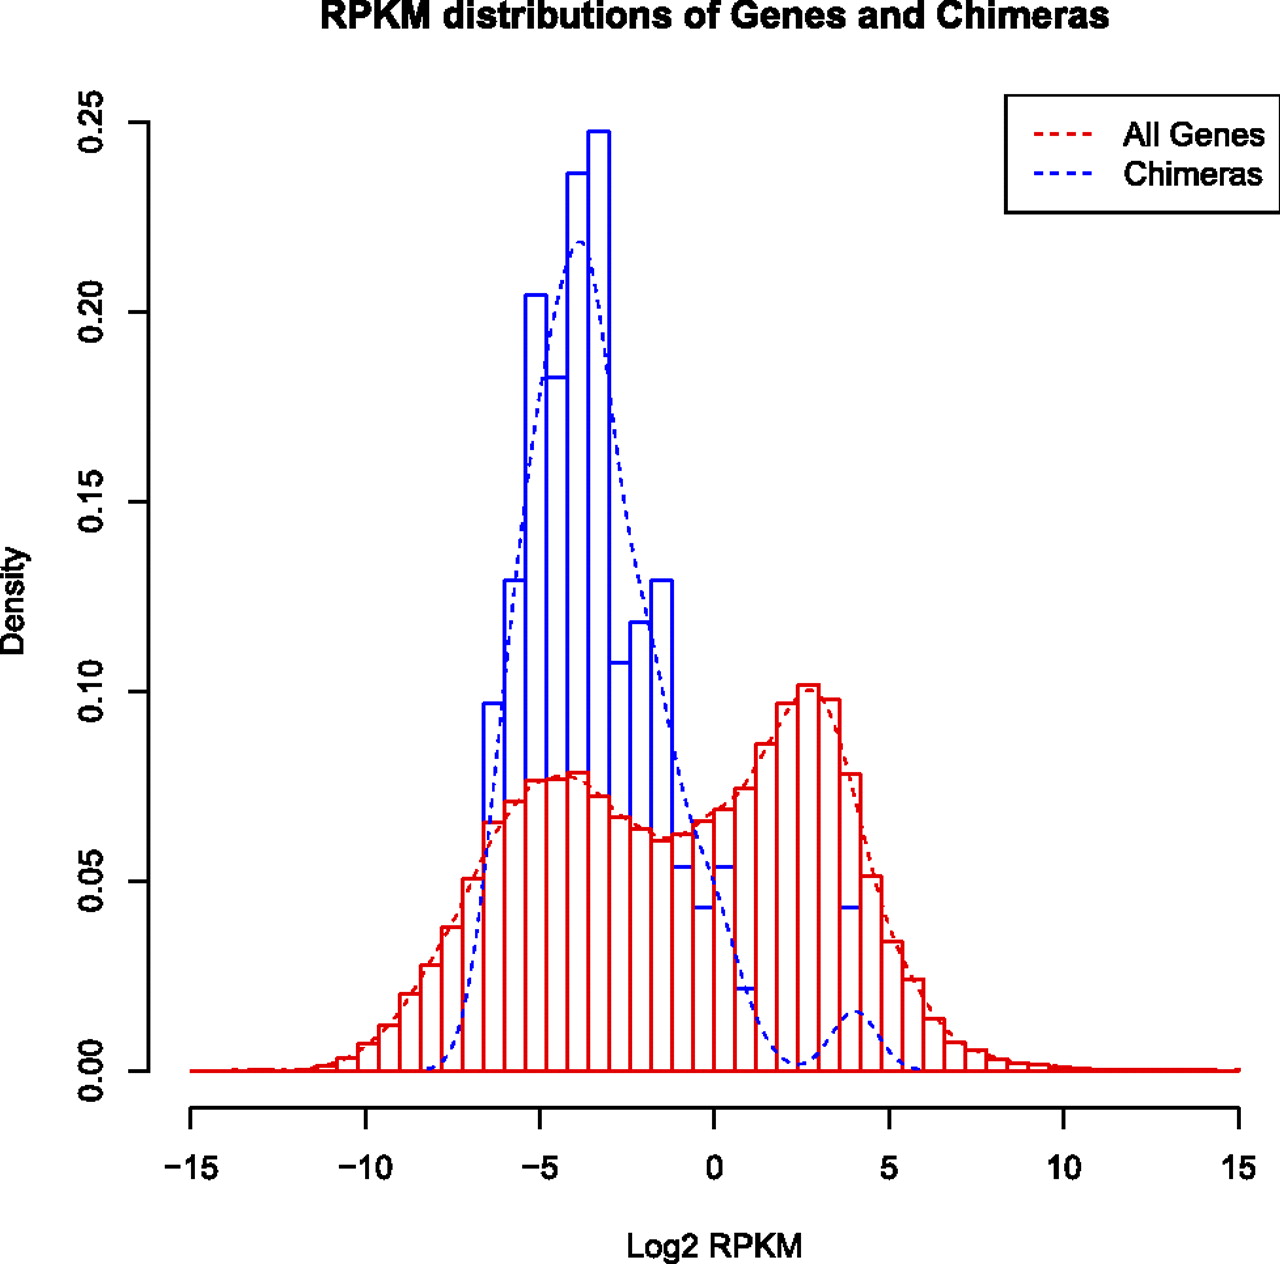
Figure 2.
A density plot of RPKM expression levels for all genes versus chimeras. The total number of chimeras is much lower than the total number of genes. Hence, the densities of the distributions are plotted and not the counts. The height of the bars does not correspond to number of transcripts, but to the proportion of transcripts in a given expression category. The distribution for all genes is bimodal, with chimeras falling in the low expressed genes distribution.


