
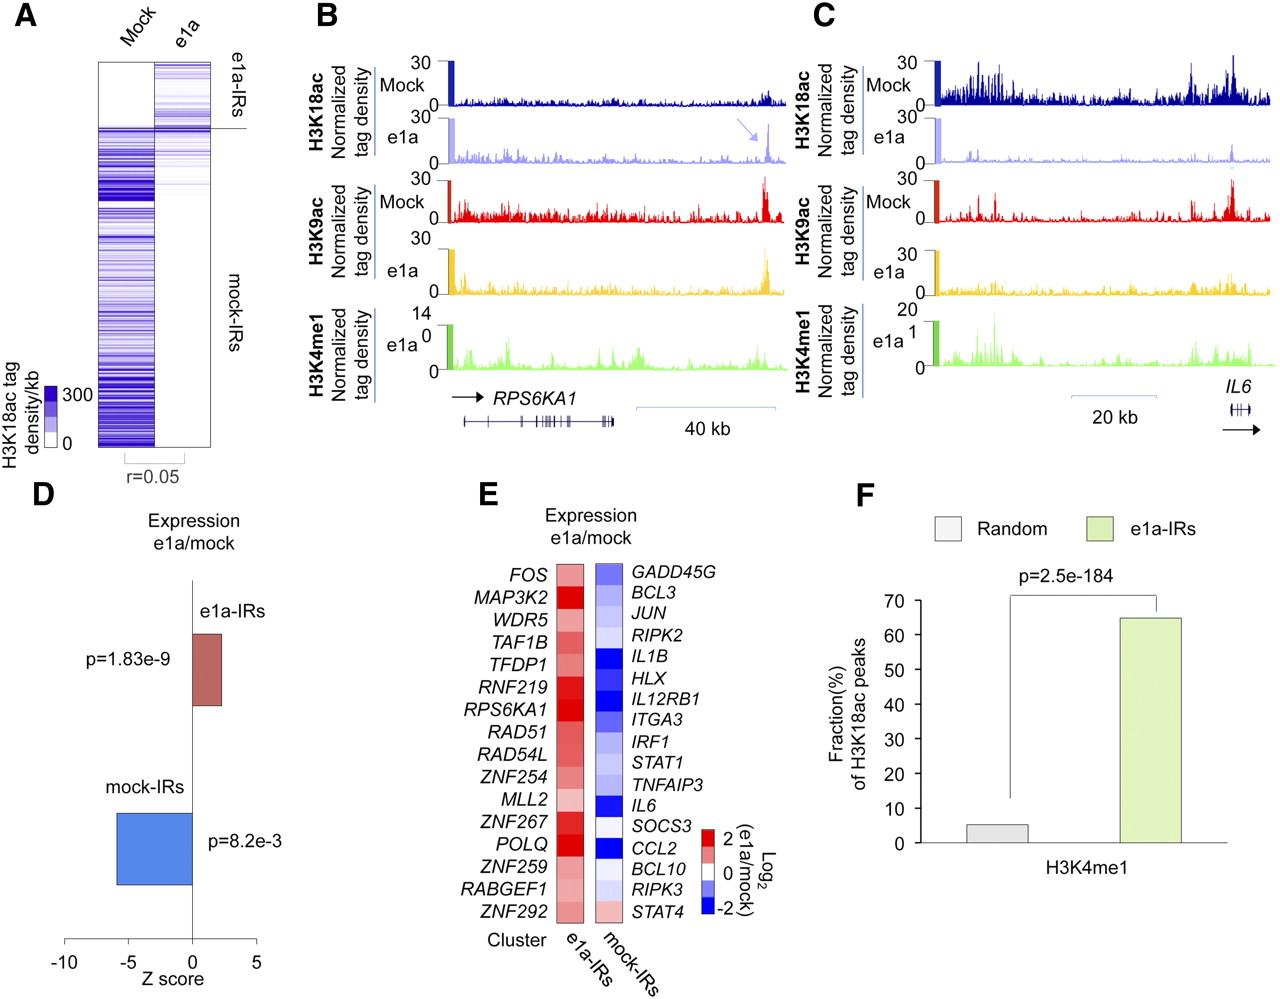
Intergenic peaks of H3K18ac coincide with potential distal regulatory elements to control gene expression. (A) The total H3K18ac tag density (number of sequence tags per kb) in intergenic regions (IRs) that are affected upon e1a expression is shown as a heat map. “Mock-IRs” and “e1a-IRs” are intergenic regions that harbor significant H3K18 acetylation in mock- or dl1500-infected cells, respectively. Distributions of H3K18ac, H3K9ac, and H3K4me1 in mock- and dl1500-infected cells around the RPS6KA1 (B) and the IL6 loci (C) are shown. (D) Relative gene expression changes of the e1a- and mock-IRs clusters after e1a expression at 24 h p.i. (E) Expression levels of candidate genes associated with e1a- and mock-IRs clusters are shown as heat maps. (F) Bar plot showing the fraction of H3K18ac peaks in the e1a-IRs that coincide with H3K4me1 in e1a-expressing cells.


