
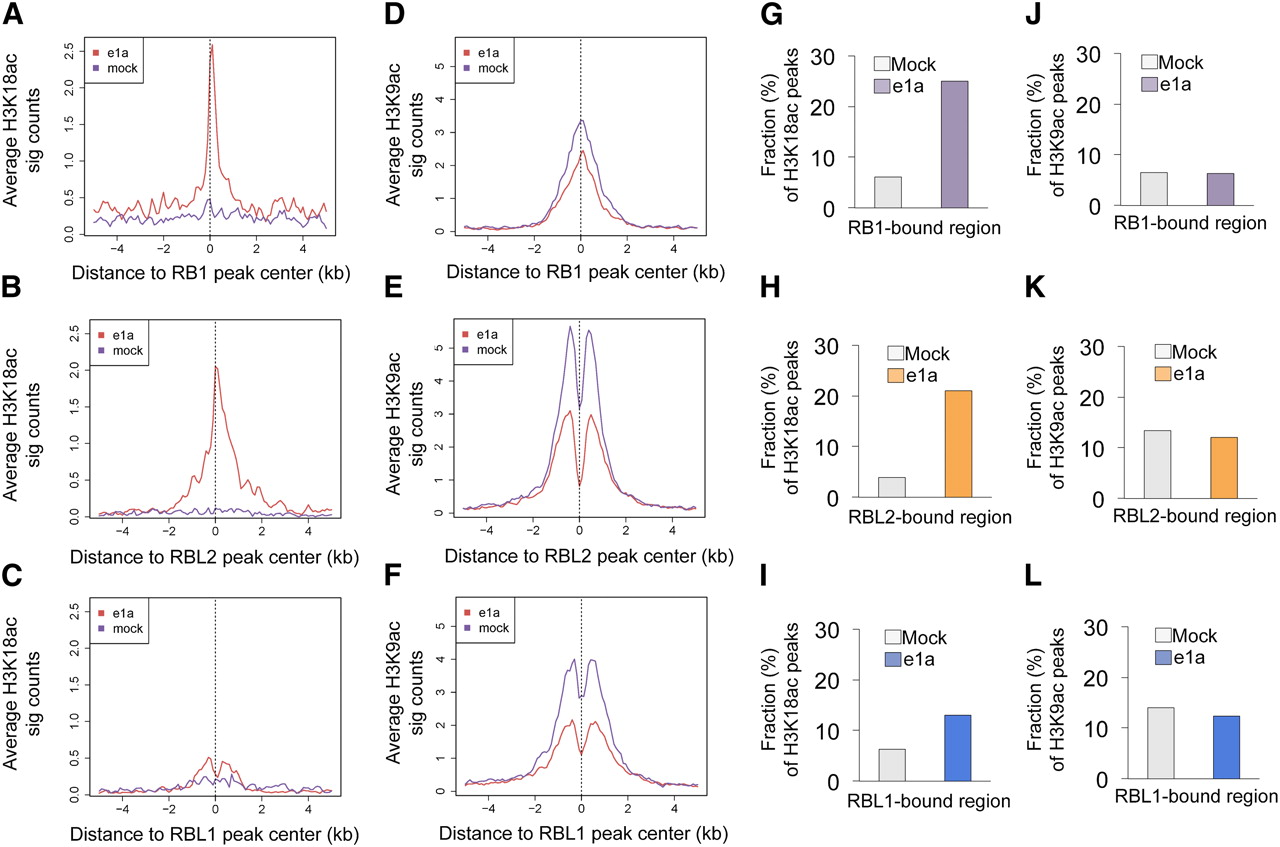
Figure 5.
Genome-wide peaks of H3K18ac in the infected cells are established at regions that are bound by RB1, and to some extent RBL2, in uninfected cells. Average levels (sig. counts) of H3K18ac and H3K9ac in mock- and dl1500-infected (e1a) cells, respectively, are shown relative to (A,D) RB1-centered peaks, (B,E) RBL2-centered peaks, and (C,F) RBL1-centered peaks. (G–I) The fractions of H3K18ac peaks in mock- and dl1500-infected (e1a) cells that are within 5 kb of RB1, RBL2, and RBL1 peaks in mock-infected cells are shown as bar charts. (J–L) The same analysis as in G–I for H3K9ac.


