
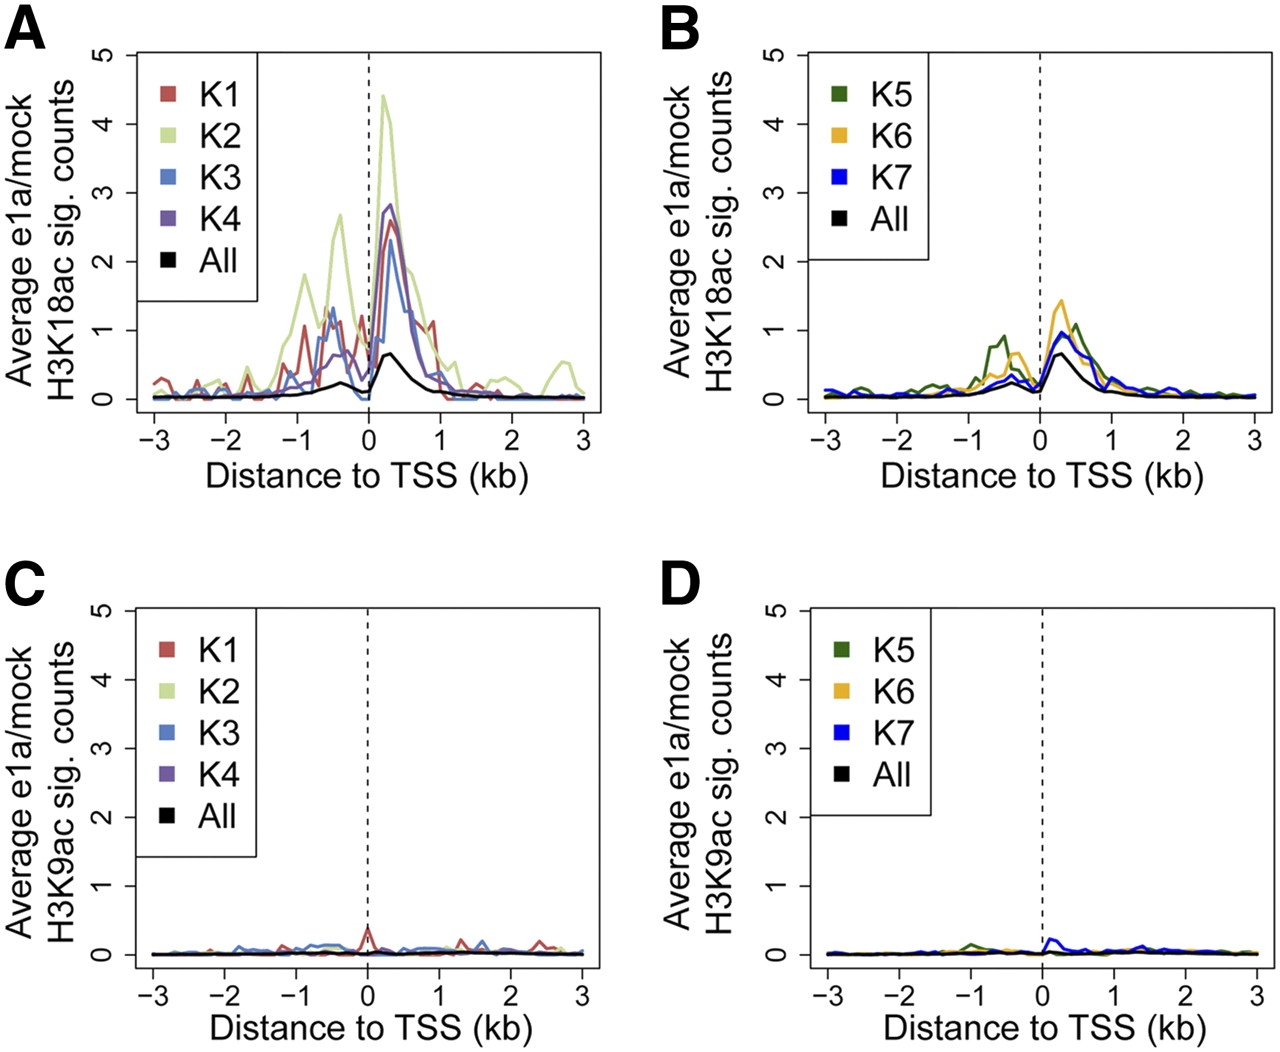
Figure 4.
Relationship of the RB-binding clusters to histone acetylation change. (A,B) Average significant (sig.) counts of change in H3K18ac levels in dl1500- versus mock-infected cells are shown for the seven RB-clusters (see Fig. 3C). (C,D) Average significant (sig.) counts of change in H3K9ac levels in dl1500- versus mock-infected cells are shown for the seven RB-clusters (see Fig. 3C).


