
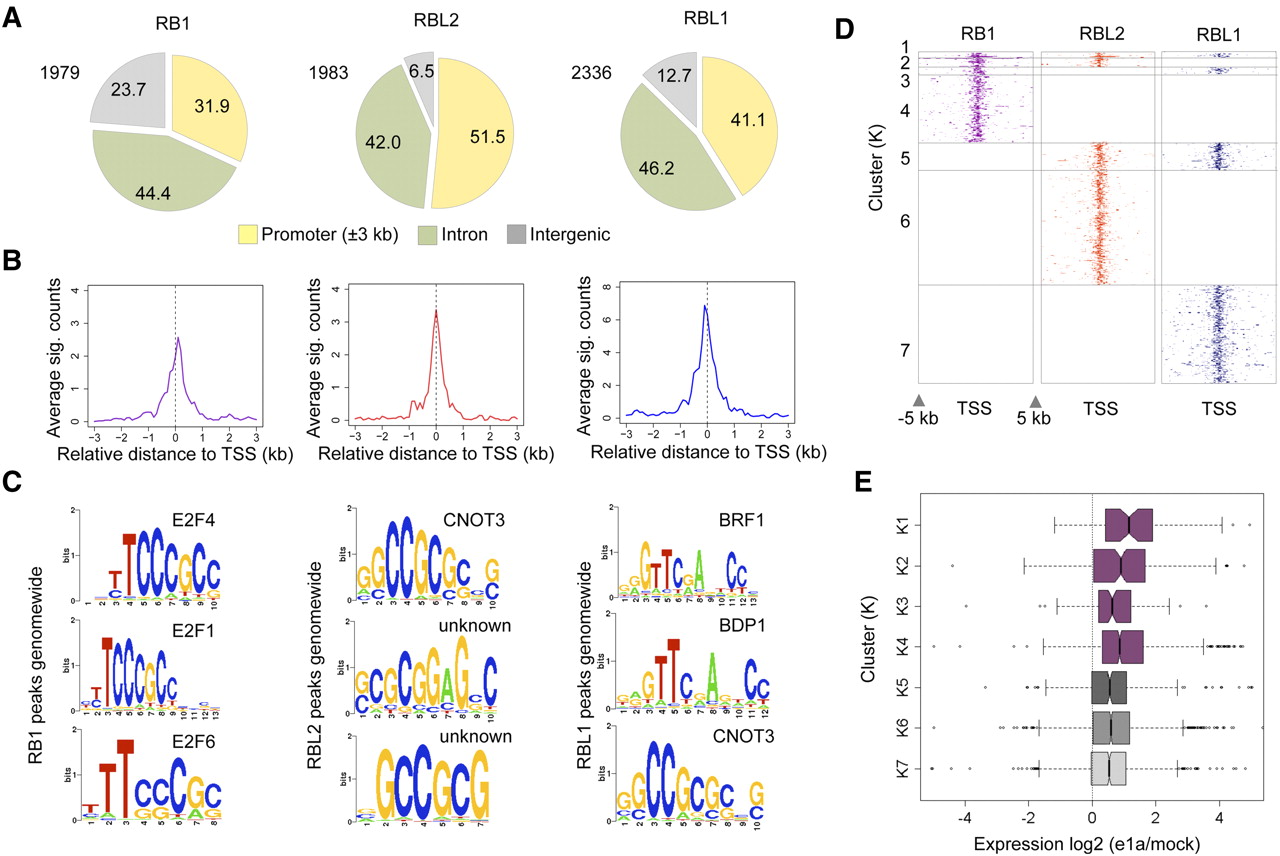
Analyses of RB-family protein genome-wide binding in contact-inhibited IMR90 fibroblasts. (A) Overview of RB1, RBL2, and RBL1 peak distributions in mock-infected cells in relation to gene structure are shown as pie charts. (B) Average binding profiles (significant counts) of the indicated RB-family members across the TSS regions of their respective target genes. (C) A 600-bp region around the peaks of RB1, RBL2, and RBL1 in mock-infected cells were analyzed for TF binding motifs using sitepro (Galaxy). Top three significant motifs for each family member are shown. All P-values are less than 1 × 10⁻¹⁰. (D) The distributions of the RB-family proteins across ±5 kb of TSS for genes with at least one RB-family member bound are shown as heat maps. The seven clusters are based on combinatorial binding patterns of the three proteins. (E) Relative gene expression changes of each of the seven clusters after e1a expression at 24 h p.i. are shown as box plots.


