
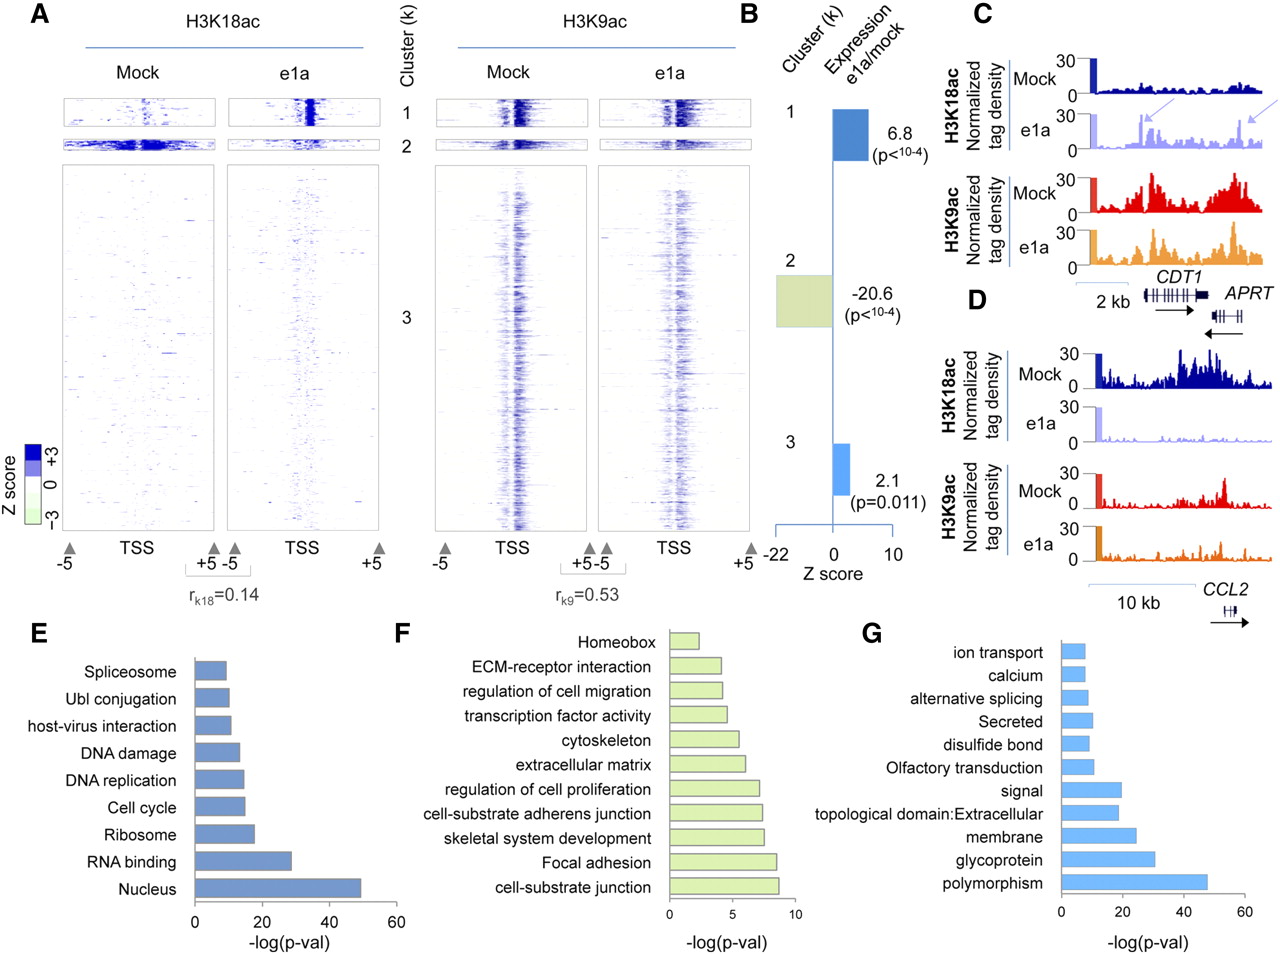
Redistribution of H3K18ac at gene promoters is associated with gene expression changes in the e1a-expressing cells. (A) The distributions of H3K18ac and H3K9ac across ±5 kb from TSSs for all annotated transcripts in mock- and dl1500-infected cells are shown as heat maps. Each row represents one gene promoter. All promoters were grouped into three clusters based on k-means clustering of acetylation data. (B) Relative gene expression changes of the three clusters after e1a expression at 24 h p.i. Note the scale. (C,D) Patterns of H3K18ac and H3K9ac at representative genes from cluster 1 (CDT1 locus) and cluster 2 (CCL2 locus). (Light blue arrows) New peaks of H3K18ac in e1a-expressing cells. (Dark arrows) Direction of transcription. (E–G) GO analyses of genes from promoter clusters 1, 2, and 3 are shown, respectively. Bars represent −log10 of the P-value for the selected GO terms.


